IN STOCK VALUATION
REPLACING THE PRICE/EARNINGS TO GROWTH (PEG) RATIO
WITH THE POTENTIAL PAYBACK PERIOD (PPP)
REPRESENTS A SHIFT FROM RULE OF THUMB
TO MATHEMATICAL PRECISION
As summarized in Investopedia article “What Is the Price/Earnings-to-Growth (PEG) Ratio?” the price/earnings to growth
ratio (PEG ratio) is a stock's price-to-earnings (P/E) ratio divided by earnings growth rate for a specified
time period.
As an equities valuation tool the PEG ratio is thought to enhance the P/E ratio because it provides a more
complete picture by introducing expected earnings growth into the calculation.
However, the way earnings growth rate (let’s call this variable “g”) is factored in to obtain the PEG ratio
(just by dividing the P/E ratio by “g”) and the way the result of the division is interpreted (with the
figure “1” being the threshold above which a stock would be considered relatively “overvalued”) show that
the PEG ratio essentially rests on a rule of thumb.
For a more rigorous adjustment of the P/E ratio to earnings growth rate there is a mathematical approach to
factor in “g” so as to arrive at another metric for stock valuation, which we call Potential Payback Period
(PPP).
See details on the PPP concept at https://www.stockinternalrateofreturn.com/index.html
See mathematical demonstration at https://www.stockinternalrateofreturn.com/Mathematics.html
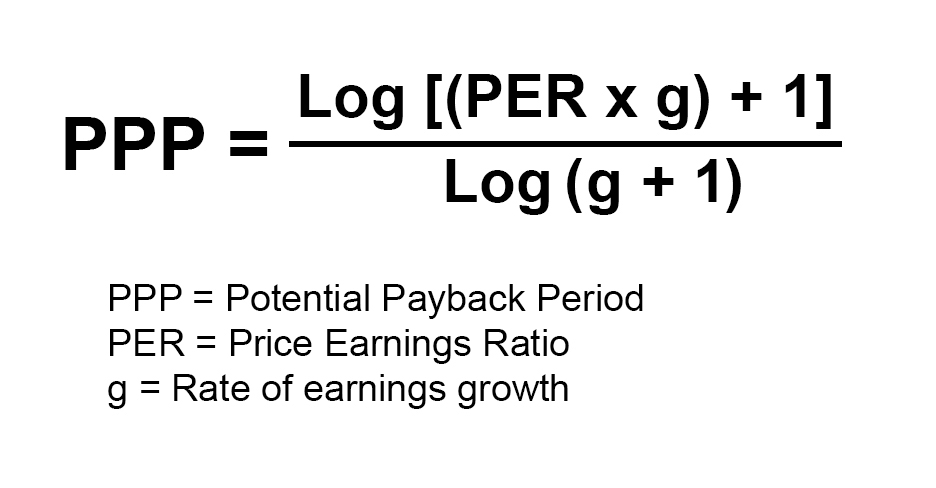
The Potential Payback Period (PPP) is defined as the precise amount of time necessary to equalize the
current stock price with the sum of future earnings per share after taking into account their growth rate.
Therefore the PPP is a mathematical adjustment of the traditional P/E ratio to earnings growth rate, thus
allowing more meaningful stock valuation and comparison.
The higher the earnings growth rate “g” the shorter the PPP. The PPP is viewed in the same way as the P/E
ratio, meaning the smaller the amount of the metric the more attractive the stock, all else being the same.
After all, the P/E ratio is only a special case of the PPP where there is no earnings growth. As explained
in Investopedia article “What Is the Price-to-Earnings (P/E) Ratio?”, “Simply put, a P/E ratio of 15 would
mean that the current market value of the company is equal to 15 times its annual earnings. Put literally,
if you were to hypothetically buy 100% of the company’s shares, it would take 15 years for you to earn back
your initial investment through the company’s ongoing profits assuming the company never grew in the
future.”
Because we must reject the unrealistic “0 growth” assumption, we have to factor in the earnings growth rate
“g” as in the above PPP formula.
For example, if g = 8 (percent per year), the adjusted P/E ratio or PPP would amount to 10.24 (down from 15
if g = 0).
Make instant calculations at https://stockinternalrateofreturn.com/instant_calculations.html
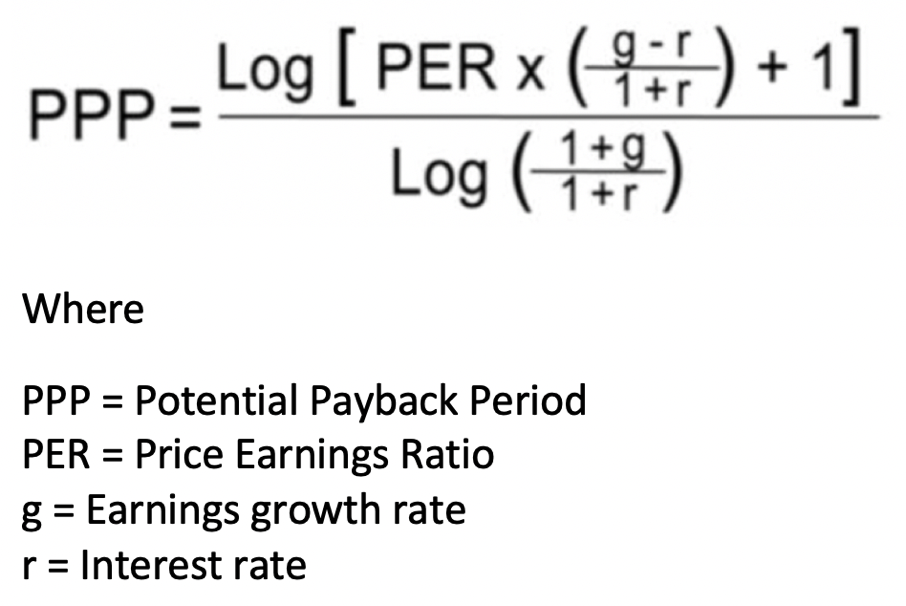
Furthermore, in order to take into account inflation and an opportunity cost for any investor in shares,
future earnings must be discounted to their present values using a long-term risk-free interest rate as the
discount rate, which we call “r”.
The introduction of interest rate “r” as discount rate transforms the PPP formula as follows:
See demonstration at https://www.stockinternalrateofreturn.com/Mathematics.html
Continuing with the above example (with P/E ratio = 15 and g = 8), if r = 3 (percent), then PPP = 11.54 (up
from 10.24 when r = 0).
Because its calculation is more rational and the results obtained are more meaningful and homogeneous, the
PPP is best suited for equities valuation and comparison.