HOW TO EVALUATE STOCKS WHEN THE P/E RATIO BECOMES IRRELEVANT
IN THE CASES OF STARTUPS AND TURNAROUND SITUATIONS
(When EPS < 0 or
EPS ≃ 0)
INTRODUCING THE POTENTIAL PAYBACK PERIOD (PPP)
For an instant calculation of the PPP of any stocks go to
www.stockinternalrateofreturn.com/instant_calculations.html
Investors sometimes need to evaluate companies for which the P/E ratio
(price-to-earnings ratio) is meaningless, at least temporarily. This is
particularly the case with startups or companies in turnaround
situations.
In a common scenario, these companies often report losses for the
current year (referred to as "year 0"), followed by results close to
zero for the next year (referred to as "year 1"), and then a more
"normal" profit in the following year (referred to as "year 2"). It is
from this "year 2" that the company will enter a steady growth phase
characterized by more or less regular profit growth.
In such an example, the company’s P/E ratios for year 0 and year 1
cannot be meaningfully calculated, and therefore, the company in
question cannot be compared with other companies in the same sector that
have well-defined P/E ratios.
This is where the concept of "payback period" (PP) or "potential payback
period" (PPP) proves to be useful (see
“Analyse
Financière,”
the review of the French Society of Financial Analysts, 3rd quarter of
1985).
Unlike the P/E ratio, which measures the value or "expensiveness" of a
stock for a single year, the PPP does so over a much longer period.
Initially, the two concepts are quite similar. For example, a P/E ratio
of 10 means it takes 10 years of earnings per share to equalize or
potentially "recover" the current stock price. But we assume here that
there is no profit growth or inflation over the years. In this case, the
P/E ratio is a kind of potential payback period (PPP) in a static world,
and it is also expressed in years like any other "period."
In reality, the PPP only adjusts the P/E ratio by introducing a profit
growth rate and an interest rate used to discount future profits. This
discount rate reflects inflation but also an opportunity cost, as the
investor who buys a stock forgoes the return they would get from a
long-term bond with much lower risks.
In other words, while the P/E ratio is a snapshot of a stock value based
on earnings for a single year, the PPP is a video that captures the
evolution of these earnings over a more or less extended period, which
is defined as the "period" required for the present value of future
earnings to equal the current stock price.
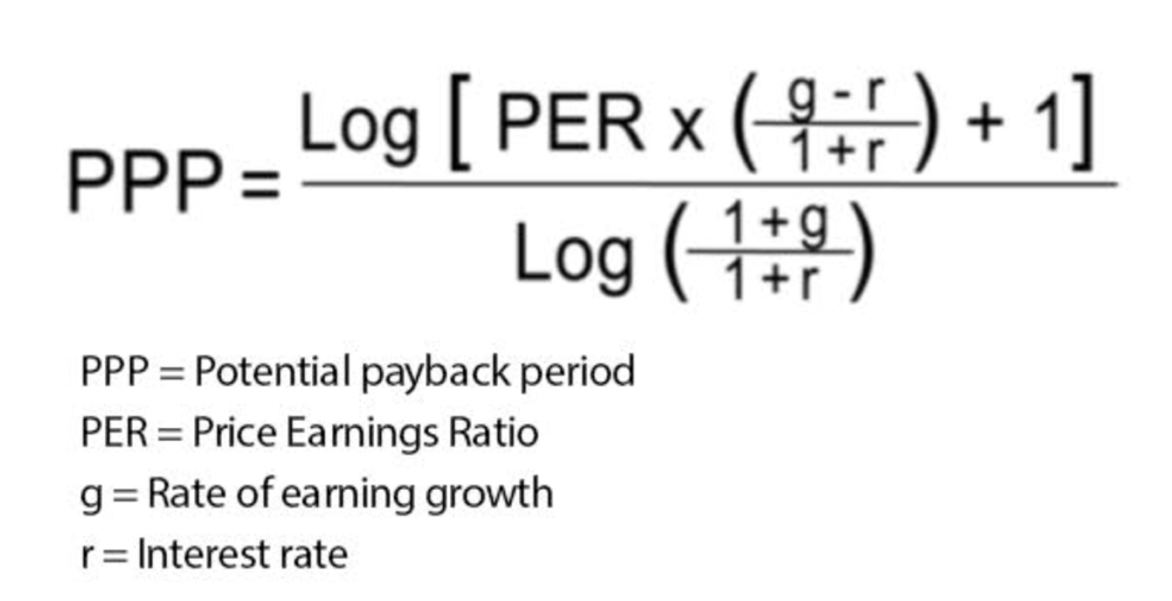
The PPP is, in fact, a measure of a company's earnings capacity, knowing
that this anticipated earnings capacity over the medium and long term is
what truly determines the value of the stock in the market.
The PPP is calculated using the following formula:
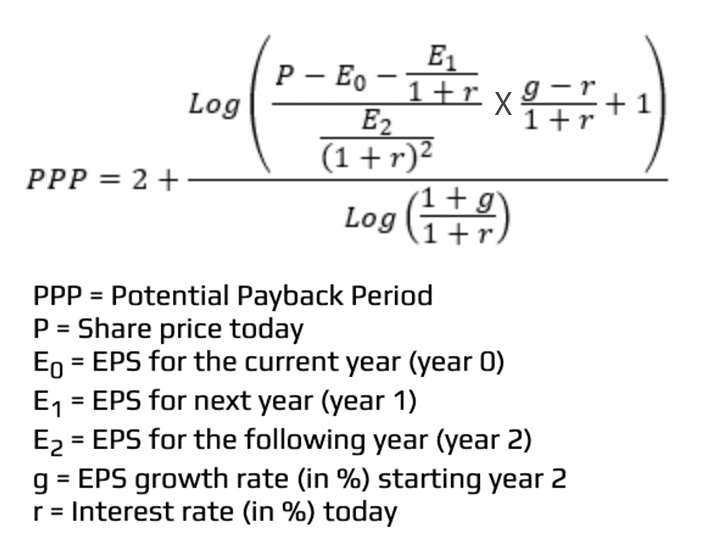
In the case of special situations like startups or companies in
turnaround situations as mentioned earlier, we can adapt the general PPP
formula above by directly introducing the loss for year 0, the near-zero
result for year 1, and the "normal" profit for year 2, from which we
apply a constant profit growth rate.
The adapted formula is as follows:
Let's take the example of a company A for which the P/E ratio is not
meaningful with the following data: P = 100, E0 = -10, E1 = 0, E2 = +10,
g = 8, r = 3.
Instant calculations can be performed
here
The result is: PPP = 11.47.
This PPP of 11.47 is quite significant as a "period" expressed in years,
and it can be meaningfully compared with the PPP of any other company,
regardless of its P/E ratio, whether that P/E ratio is meaningful or
not.
Now, consider the case of a company B that resembles company A in some
ways -- first with an identical share price of 100 -- but with a more
regular earnings growth. Its earnings per share start at 10 in year 0
and increase steadily by 8% per year. With a P/E ratio of 10 from the
start (100/10) and the same interest of 3%, applying the basic PPP
formula indicated at the beginning of this text yields: PPP = 8.35.
In any case, company A's PPP of 11.47 can be directly compared to
company B's PPP of 8.35, while no comparison is possible based on the
P/E ratio.
The PPP is used in the same way as the P/E ratio. All else being equal,
the attractiveness of a stock is inversely proportional to its PPP.
Thus, in the example above, company B with a PPP of 8.35 is more
attractive or less "expensive" than company A with a PPP of 11.47.
In summary, relying solely on the P/E ratio to assess the value or
"expensiveness" of stocks can lead to absurd results. Indeed, the P/E
ratio can reach astronomical levels when earnings per share for the
chosen year are close to zero, and it loses all meaning in the case of
losses for the considered year. In contrast, the PPP can be meaningfully
calculated for any stock at any time, even for startups or companies in
turnaround situations involving temporary losses.