HOW TO CORRECTLY EVALUATE HIGH-GROWTH STOCKS
WITH "PROHIBITIVE" P/E RATIOS?
SUMMARY : Why do some
high-growth stocks with "prohibitively" high P/E ratios continue to
outperform the market? To correctly evaluate such stocks we need to
rigorously adjust their P/E ratios to the corresponding earnings growth
rates and the prevailing interest rates so as to make any comparison
significant in terms of value.
The Payback Period (PP) and the Internal Rate of Return (IRR) used in
corporate finance for industrial investment selection can be adapted to
become two equally (and closely related) operational tools for stock
selection.
Considering that the value of a stock primarily reflects a company's
profit-making capacity (or earnings potential), the PP and the IRR allow
for the explicit and rigorous inclusion of this profit-making capacity,
thereby evaluating the stock in a more comprehensive and meaningful
manner than the traditional and static P/E ratio.
Let’s take a
concrete example
involving two major American companies in the semiconductor and
artificial intelligence sectors: As of January 21, 2024, is NVIDIA with
a P/E ratio of 77.8 (and an annual earnings growth rate of 50%) really
more "expensive" than TEXAS INSTRUMENTS (TI) with a P/E ratio of 22.3
(and an annual earnings growth rate of 8%)?
The answer is "No" and it is "The other way round" because, in terms of
PP and IRR, NVIDIA is much more attractive with a PP of 9.71 (versus
16.25 for TI) and a IRR of 7.40% (versus 4.36% for TI), at a time when
the yield on US 10-year Treasury note stands at 4.14%.
Among the stocks with the highest P/E ratios NVIDIA is actually one of
the most promising to buy as long as its earnings per share continue to
grow at an annual rate of 50% as suggested by the latest earnings
estimates.
Other examples of misleading P/E ratios can be found at
SIMPLY WALL ST
A group of US stocks such as NVIDIA, ALPHABET, AMAZON, APPLE, META and NETFLIX have in common their relatively recent creation and exponential growth in sales and profit, coupled with exponential increases in their share prices.
Such valuations have led to price-to-earnings ratios (PERs) which, by traditional criteria, appear extremely high. Nevertheless, those high-growth stocks have been outperforming the market over the last ten years or more. Intuitively, we accept the idea of relatively high PERs for companies with fast growth. But how high is justified, and where is the limit? Can we still buy these shares and at what price should they be sold?
The following formula for calculating the potential payback period (PPP) for an investment in any industrial stock can help to give an answer. The PPP concept was explained in several issues of the French publication "Analyse Financière" as well as in the reference book "Finance d'Entreprise" (Corporate finance) by the late Pierre Vernimmen, who was a professor at France’s most prestigious business school HEC.
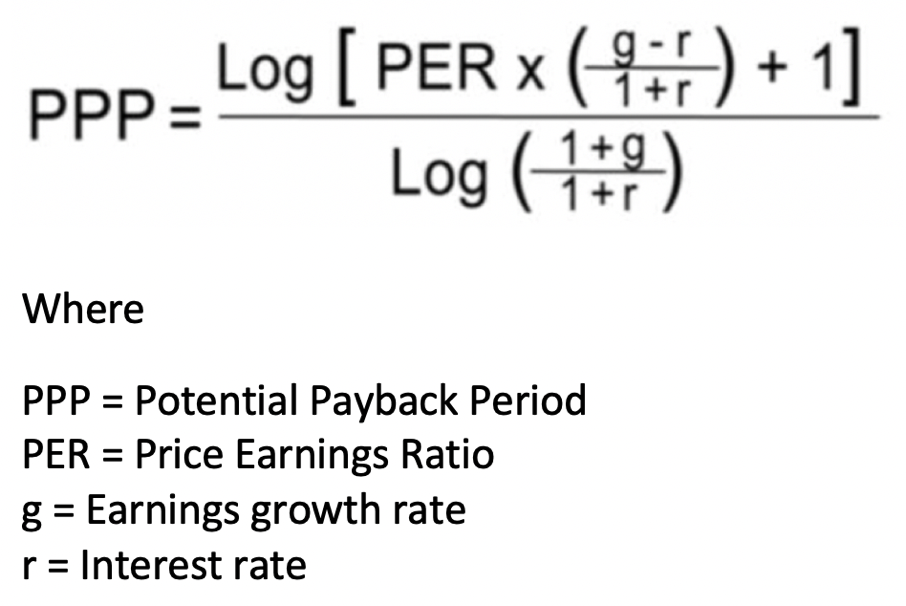
The PPP puts the PER into context in a rigorous way by using the expected rate of earnings growth to calculate how long it will take for the investment to potentially repay itself, that point being reached when the current share price is equal to the sum of future earnings per share. The future earnings are discounted to their present value using a long-term interest rate as the discount rate. We use the long-term bond yield as this represents the opportunity cost for an investor in shares.
The PPP, which adjusts the PER to earnings-per-share growth rate and long-term interest rate, is a rigorous measure of a company's profit-making capacity, which is fundamental for its evaluation in the stock market. When an investor buys a stock, it is with the hope of seeing an increase in the price of that stock. The capital gain the investor will make will essentially depend on the profit-making capacity of the corresponding company
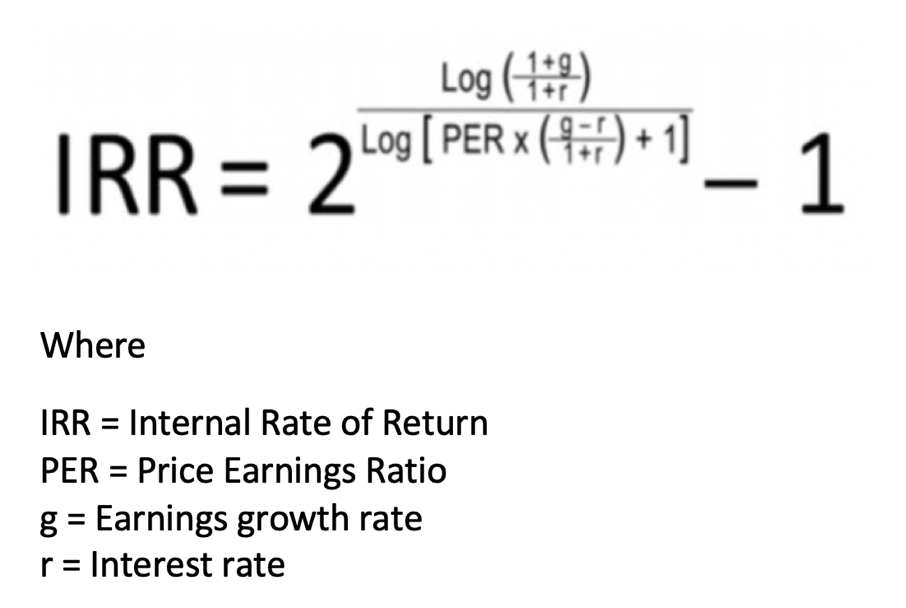
The next step is to work out, from the PPP, the internal rate of return (IRR) of the share. The PPP and the IRR are both current business finance tools for choosing investments. In corporate or business finance, the IRR is the discount rate which allows the amount of an investment to be balanced against the net cashflows expected through the investment’s lifetime. By using this business finance concept in share investing and by using the PPP as the length of the investment, we can calculate a precise rate of internal return for each share. In other terms, the IRR when applied to the stock market is the discount rate which allows the investor in a given share to potentially double their investment through the cumulation of per share earnings over the PPP which has been calculated for the stock.
For more details go to "From PER to PPP to IRR"
Expressed as a percentage, the IRR is a concrete and clear way to express the attractiveness of an investment at a given time. This applies to industrial investments as well as to investments on the stock market.
In the following examples we will show that the shares of many fast-growing companies (Nvidia, Amazon, Alphabet, etc.) can still be relatively attractive despite their very high PERs.
It should be remembered that the PPP and IRR formulas explained here use a rate of earnings growth, which is an extrapolation over a longer period of the foreseeable trend over the next two to three years. For each of the shares considered, periodic simulations of such a growth rate must be carried out. The assumptions of the model and those of investors are very sensitive to changes in the expected earnings growth, which explains the sensitivity of share prices to revisions in earnings outlooks. See Impact of earnings revisions on stock prices.