August 13, 2024
EXPLORING THE POTENTIAL PAYBACK PERIOD (PPP)
AS A BRIDGE BETWEEN STOCKS AND BONDS: AN EXAMPLE THROUGH
THE MATHEMATICAL RELATIONSHIP BETWEEN NASDAQ LEVELS
AND 10-YEAR U.S. TREASURY BOND YIELDS
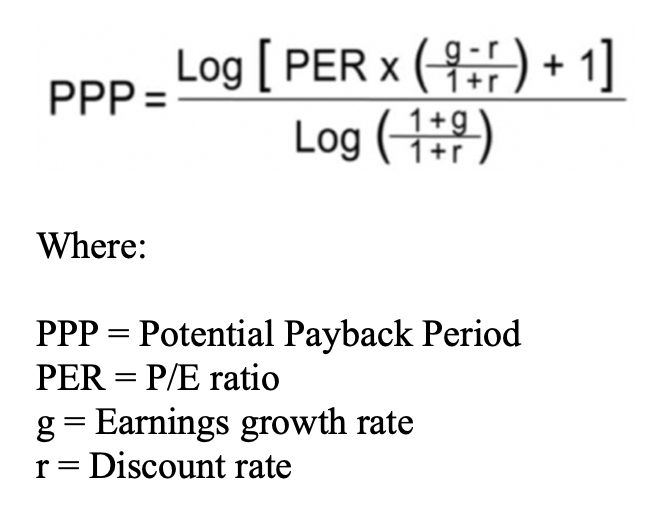
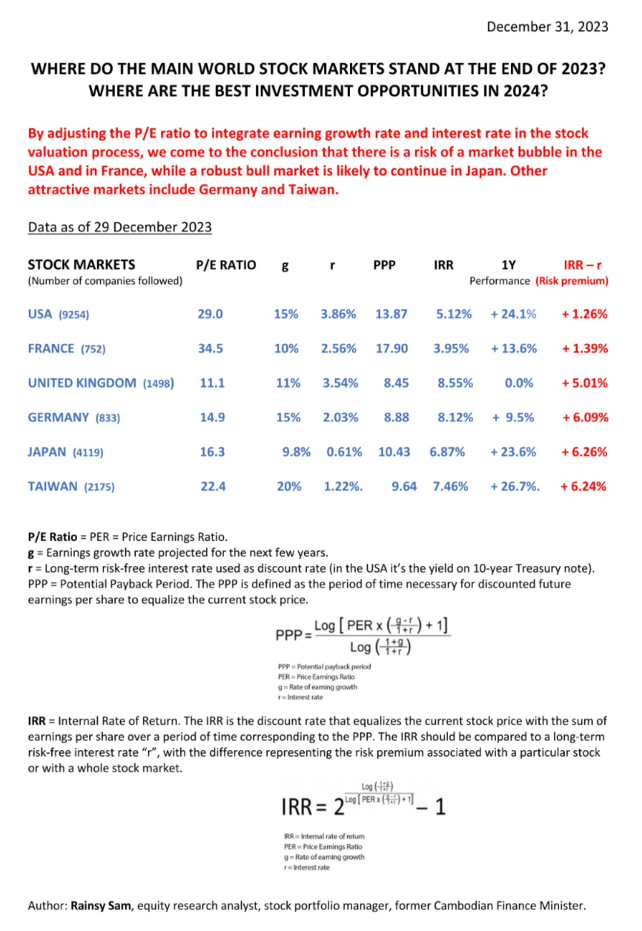
If the available data (P/E ratio, projected earnings growth rate, risk-free interest rate, expected market
return, Beta) are consistent, the NASDAQ appears close to a correction based on the Potential Payback Period
(PPP), which synthesizes all these data.
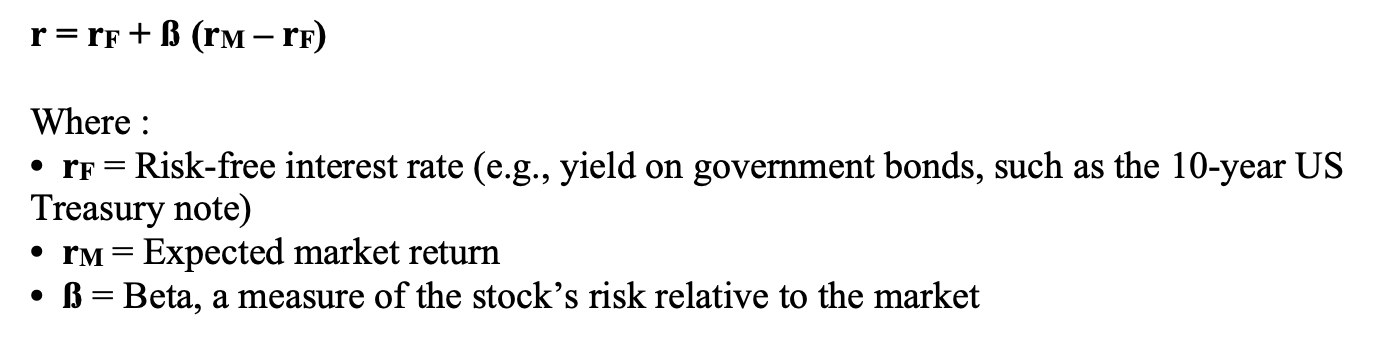
 The discount rate "r" is calculated using the Capital Asset Pricing Model (CAPM), which incorporates the
expected market return, a risk-free interest rate, and Beta (β) as a risk factor associated with any stock.
The formula for "r" is:
The discount rate "r" is calculated using the Capital Asset Pricing Model (CAPM), which incorporates the
expected market return, a risk-free interest rate, and Beta (β) as a risk factor associated with any stock.
The formula for "r" is:
 More information at https://www.stockinternalrateofreturn.com/index.html
The PPP concept can be further developed to make it a more concrete and practical evaluation tool for stocks
while keeping it closely related to corporate finance for the sake of rigor. This approach naturally led to
the "Internal Rate of Return" (IRR) applied to stocks.
From a stock’s PPP, we can deduce its IRR, recognizing that both PPP and IRR are common tools for selecting
investments in corporate finance. In corporate finance, the IRR is the discount rate that equates the
initial investment with the expected net cash flows from that investment over its lifetime. By applying this
concept to an investment in a stock and using the PPP as the investment's duration, we can derive a precise
Internal Rate of Return for each PPP value. In other words, the redefined IRR, as a tool for evaluating a
stock, is the discount rate that enables an investor to potentially double their investment through the
cumulative earnings per share over the calculated PPP period for that stock.
Expressed as a percentage, the IRR is more concrete and meaningful in conveying the attractiveness and
opportunity of an investment, whether for an industrial investment or an investment in a stock market.
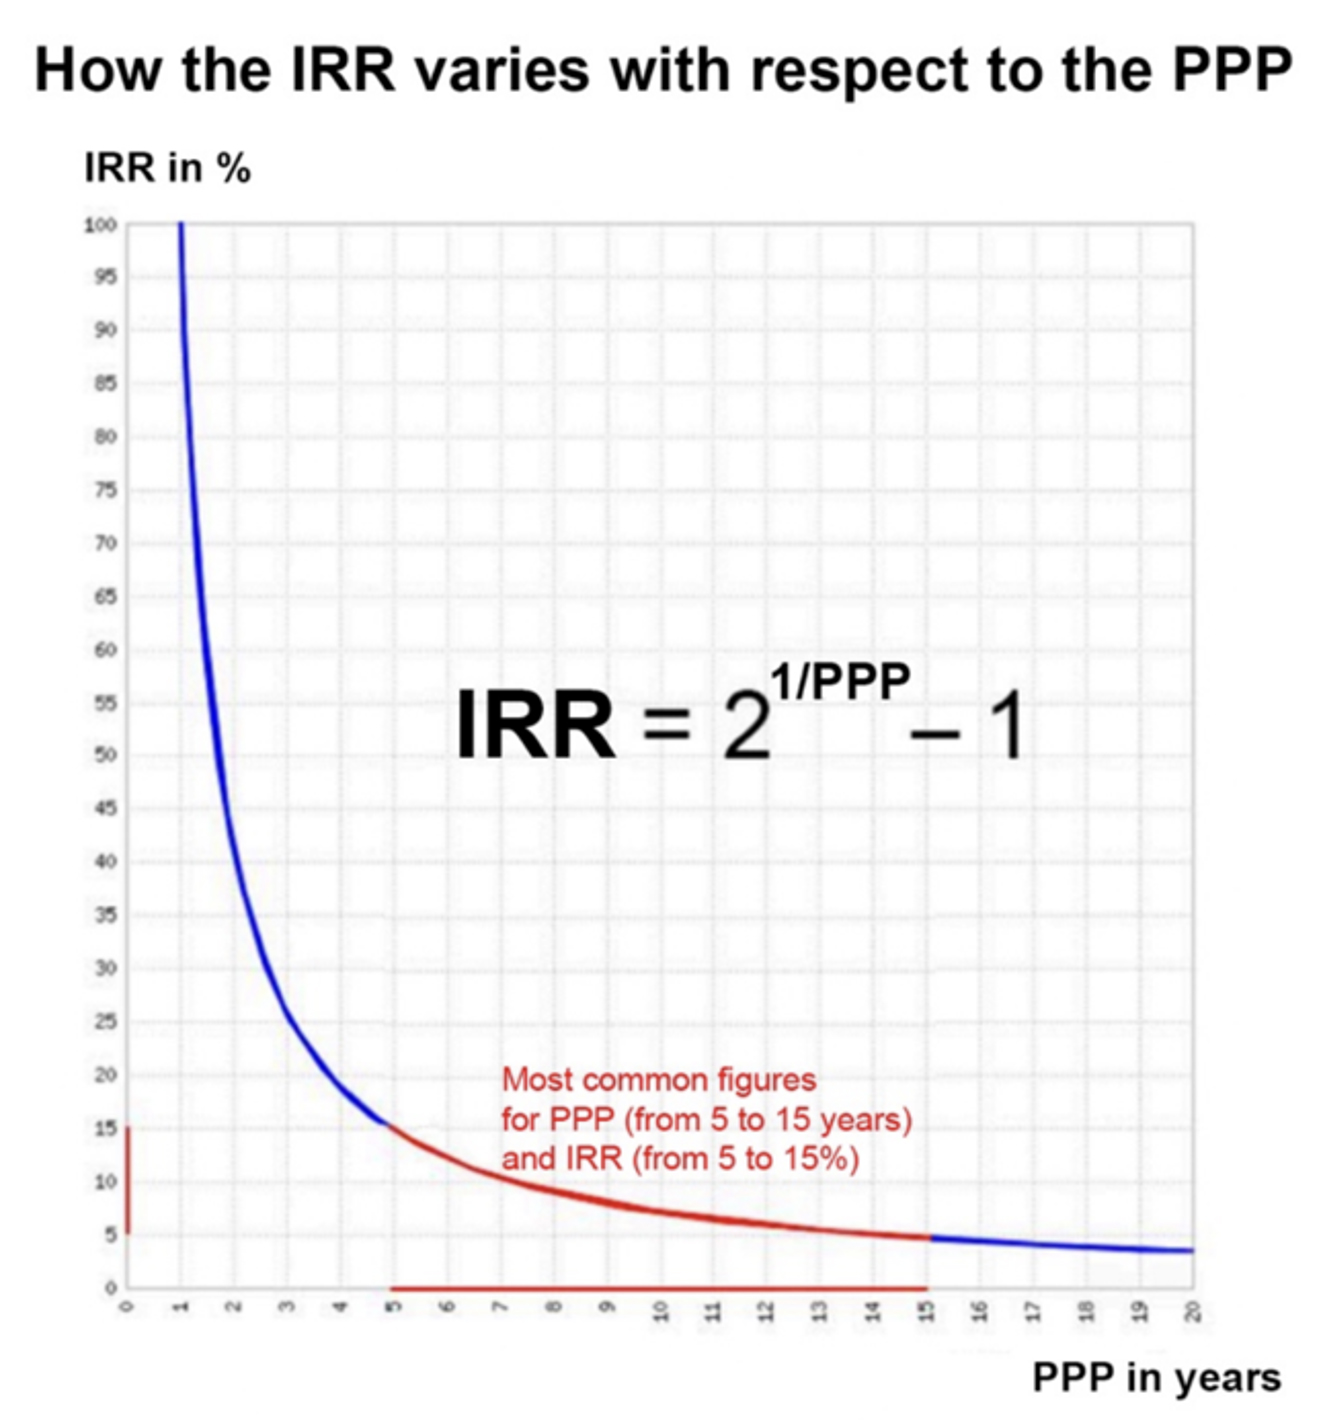
In real life, the PPP varies within a relatively narrow range of 5 to 15 years, corresponding to an IRR that
moves in the opposite direction of the PPP, ranging from 15% to 5%. These PPP and IRR figures can be
considered significant, realistic, and credible due to their reasonable order of magnitude and relative
stability, reflecting the consistency, rationality and homogeneity of financial markets, as shown in the
graph below depicting the evolution of the IRR as a function of the PPP.
More information at https://www.stockinternalrateofreturn.com/index.html
The PPP concept can be further developed to make it a more concrete and practical evaluation tool for stocks
while keeping it closely related to corporate finance for the sake of rigor. This approach naturally led to
the "Internal Rate of Return" (IRR) applied to stocks.
From a stock’s PPP, we can deduce its IRR, recognizing that both PPP and IRR are common tools for selecting
investments in corporate finance. In corporate finance, the IRR is the discount rate that equates the
initial investment with the expected net cash flows from that investment over its lifetime. By applying this
concept to an investment in a stock and using the PPP as the investment's duration, we can derive a precise
Internal Rate of Return for each PPP value. In other words, the redefined IRR, as a tool for evaluating a
stock, is the discount rate that enables an investor to potentially double their investment through the
cumulative earnings per share over the calculated PPP period for that stock.
Expressed as a percentage, the IRR is more concrete and meaningful in conveying the attractiveness and
opportunity of an investment, whether for an industrial investment or an investment in a stock market.
In real life, the PPP varies within a relatively narrow range of 5 to 15 years, corresponding to an IRR that
moves in the opposite direction of the PPP, ranging from 15% to 5%. These PPP and IRR figures can be
considered significant, realistic, and credible due to their reasonable order of magnitude and relative
stability, reflecting the consistency, rationality and homogeneity of financial markets, as shown in the
graph below depicting the evolution of the IRR as a function of the PPP.
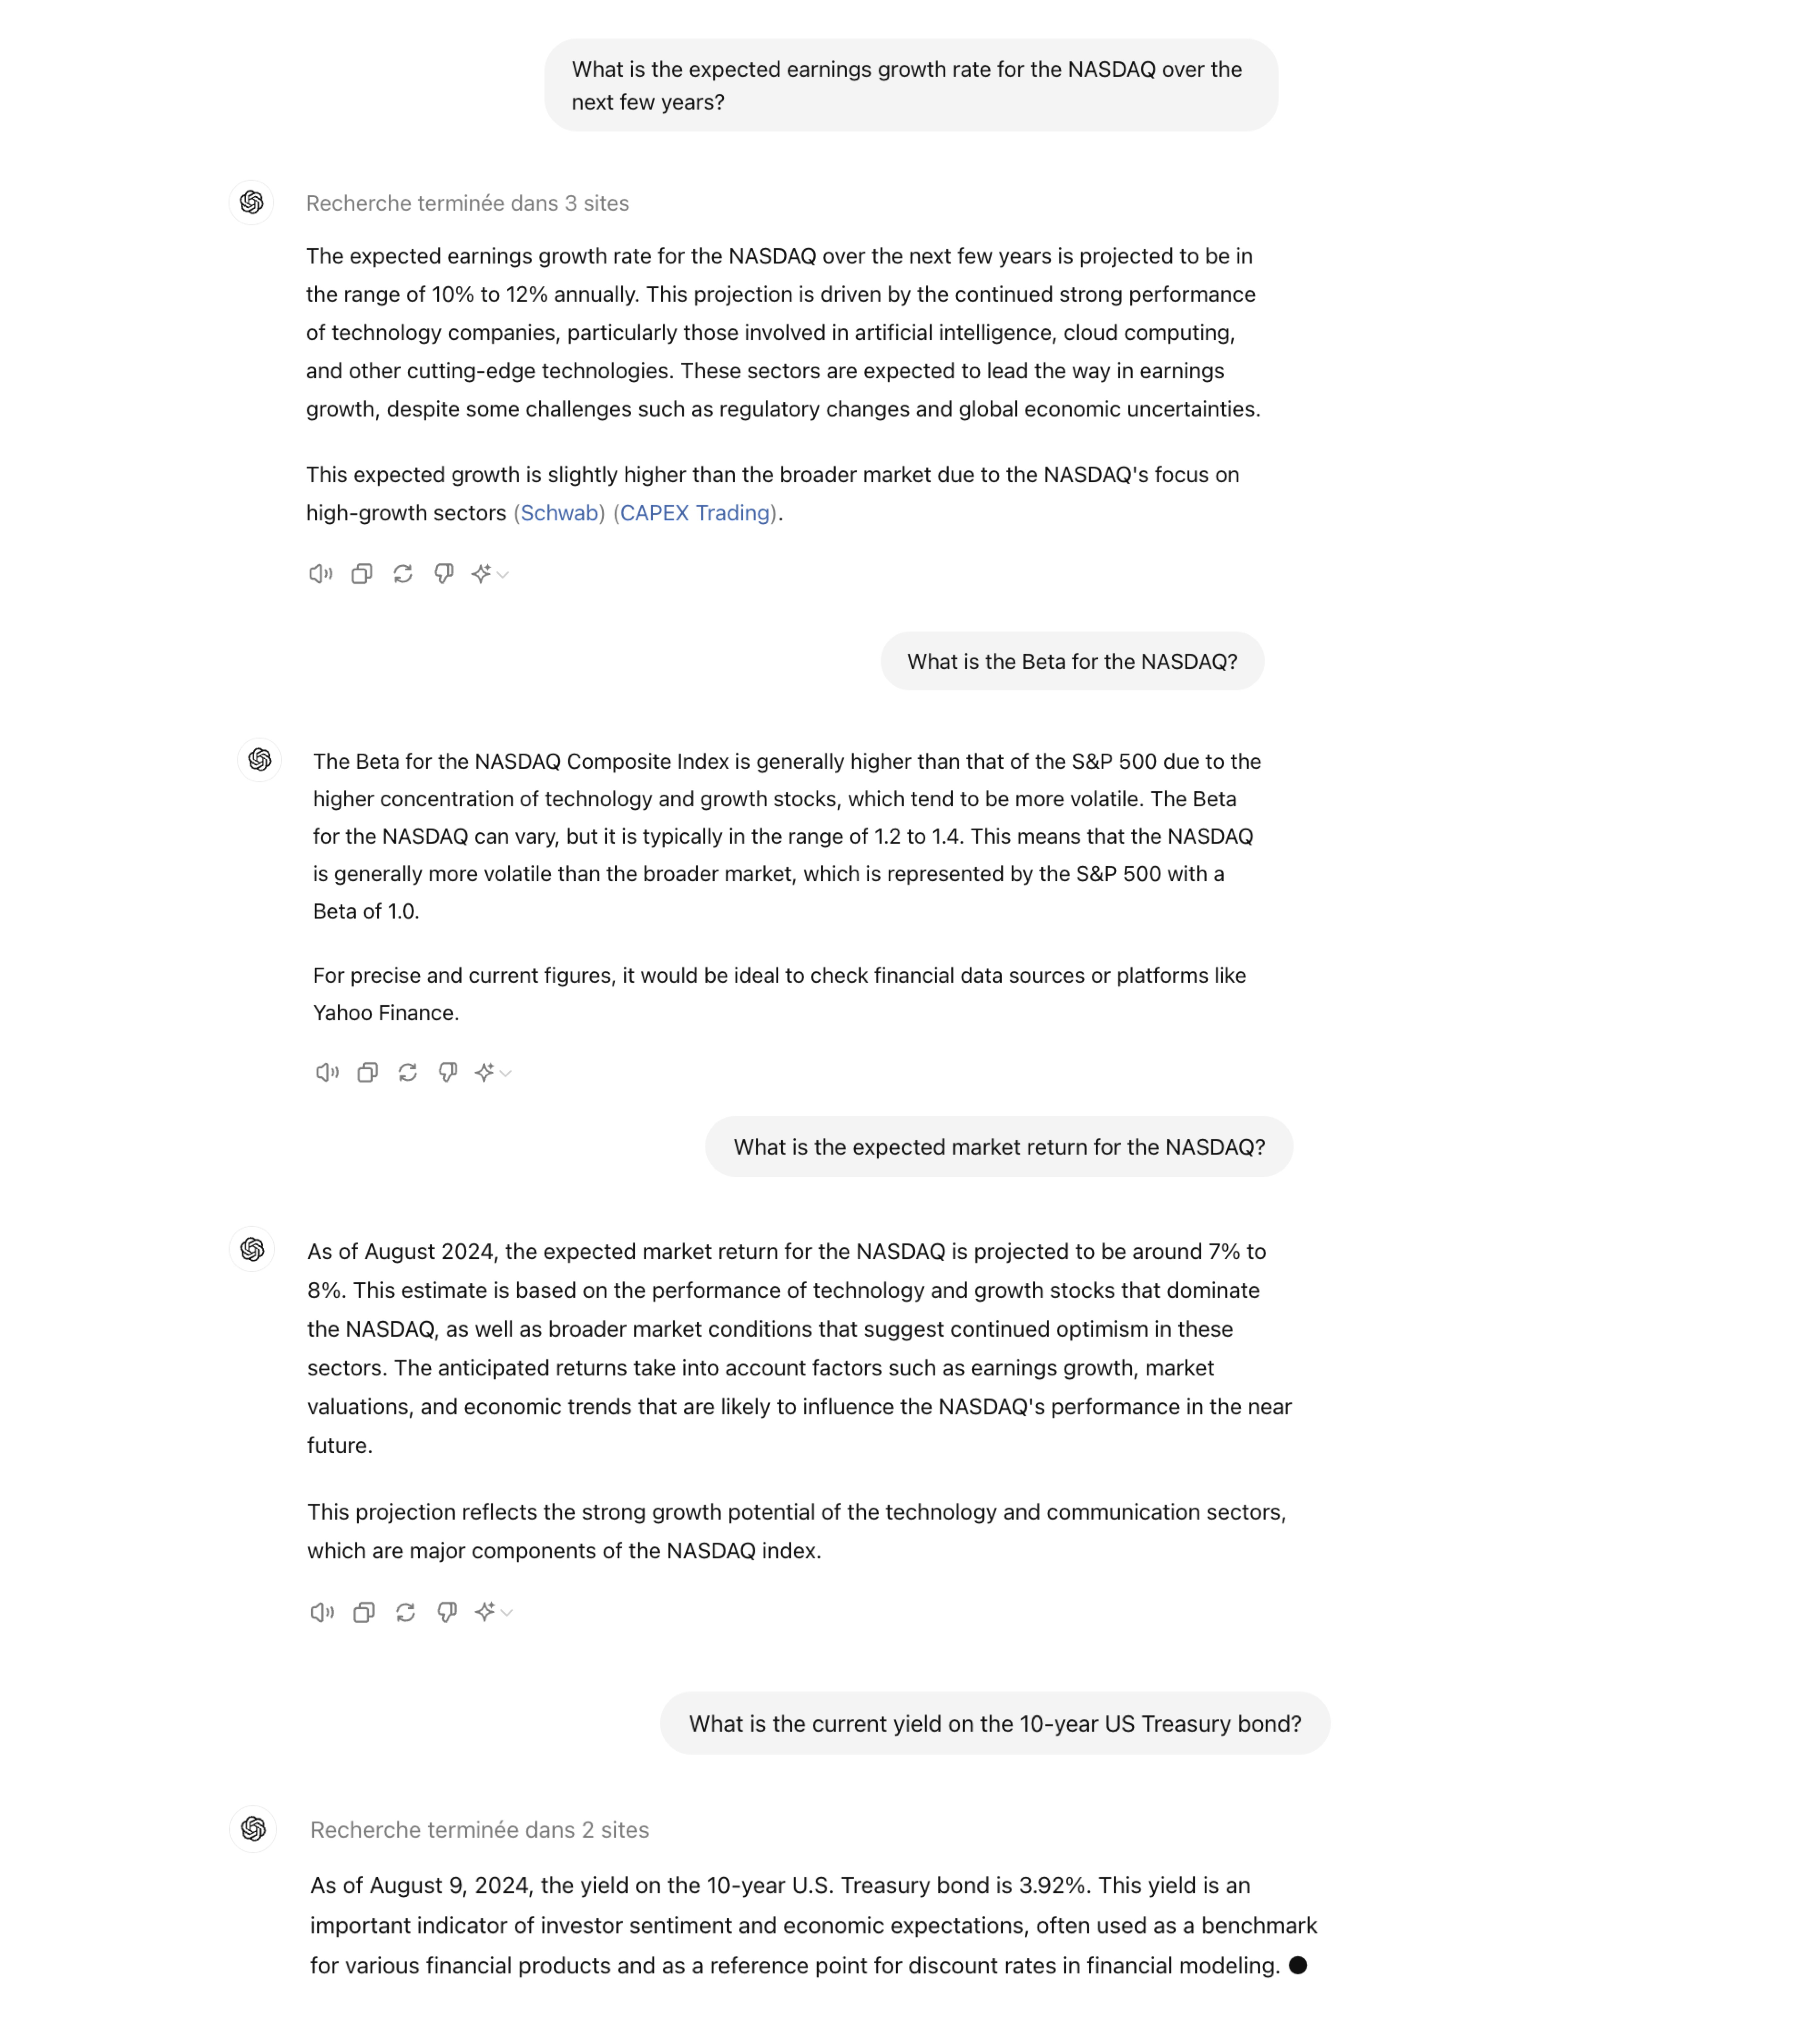
 To evaluate the attractiveness of a stock, one must compare its IRR (Internal Rate of Return) with a
risk-free interest rate, such as the yield on a 10-year U.S. Treasury bond. The IRR of the stock should be
higher than the risk-free interest rate to reflect the risk premium associated with each stock.
Currently, using the most favorable underlying data provided today by ChatGPT, the IRR of the NASDAQ is very
close to the yield on the 10-year U.S. Treasury bond: 4.07% versus 3.92%. A correction seems likely.
However, this correction will primarily affect companies that have poorer growth prospects combined with a
relatively high P/E ratio, meaning a relatively high PPP.
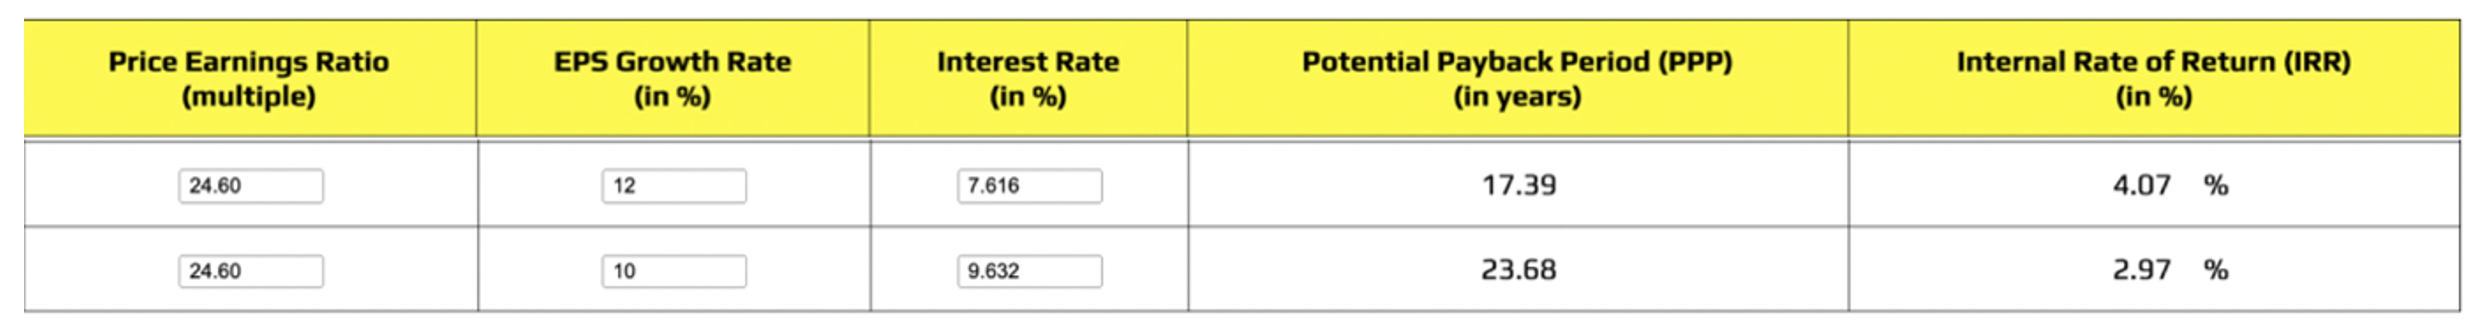
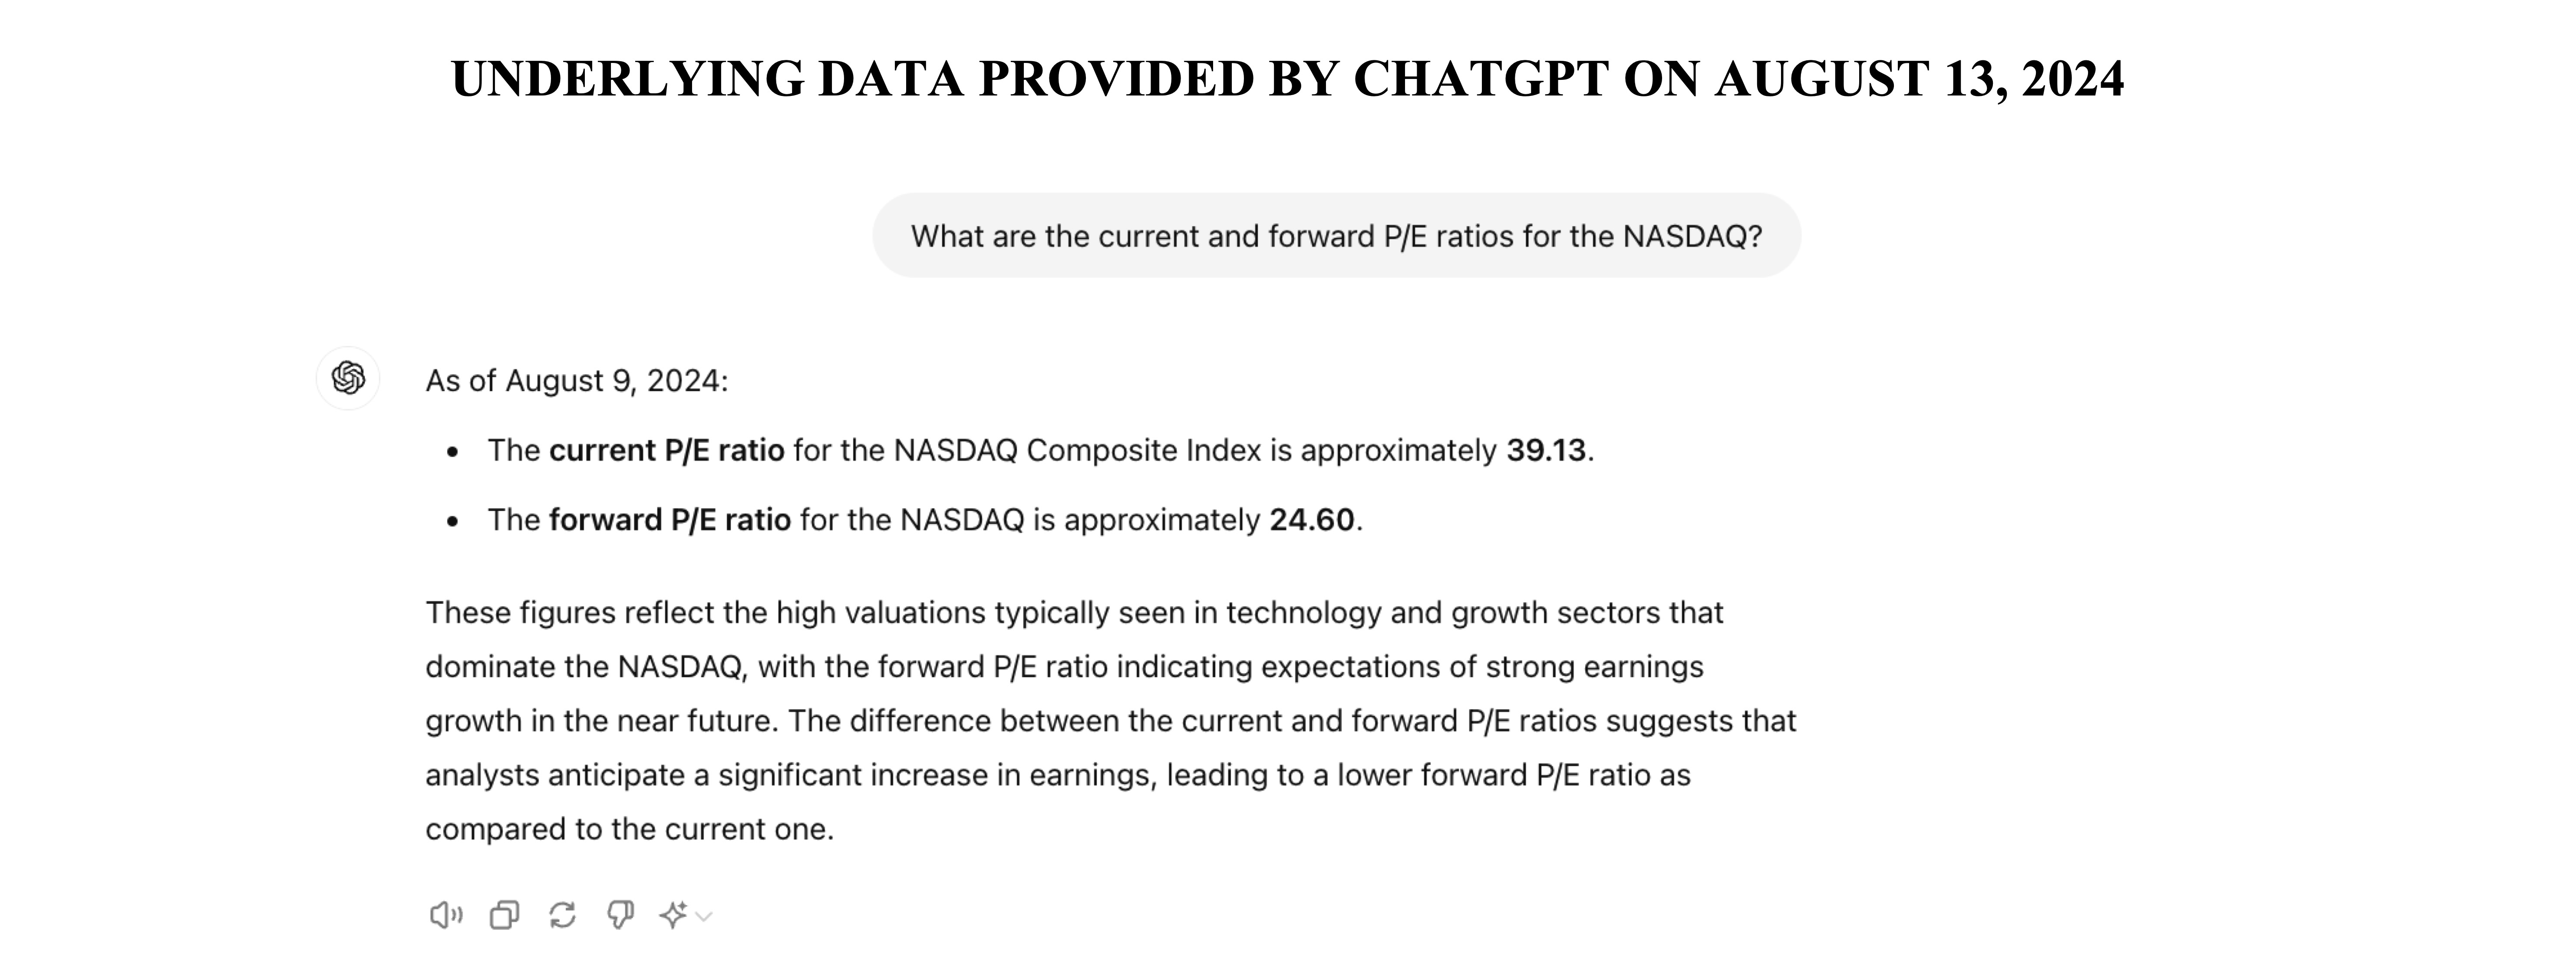
Most Favorable Scenario
• P/E ratio: 24.60
• Earnings growth rate (g): 12%
• Discount rate (r): 3.92 + 1.2 (7.00 – 3.92) = 7.616%
• PPP: 17.39 years
• IRR: 4.07%
Less Favorable Scenario
• P/E ratio: 24.60
• Earnings growth rate (g): 10%
• Discount rate (r): 3.92 + 1.4 (8.00 – 3.92) = 9.632%
• PPP: 23.68 years
• IRR: 2.97%
Instant calculations at https://www.stockinternalrateofreturn.com/instant_calculations.html
To evaluate the attractiveness of a stock, one must compare its IRR (Internal Rate of Return) with a
risk-free interest rate, such as the yield on a 10-year U.S. Treasury bond. The IRR of the stock should be
higher than the risk-free interest rate to reflect the risk premium associated with each stock.
Currently, using the most favorable underlying data provided today by ChatGPT, the IRR of the NASDAQ is very
close to the yield on the 10-year U.S. Treasury bond: 4.07% versus 3.92%. A correction seems likely.
However, this correction will primarily affect companies that have poorer growth prospects combined with a
relatively high P/E ratio, meaning a relatively high PPP.
Most Favorable Scenario
• P/E ratio: 24.60
• Earnings growth rate (g): 12%
• Discount rate (r): 3.92 + 1.2 (7.00 – 3.92) = 7.616%
• PPP: 17.39 years
• IRR: 4.07%
Less Favorable Scenario
• P/E ratio: 24.60
• Earnings growth rate (g): 10%
• Discount rate (r): 3.92 + 1.4 (8.00 – 3.92) = 9.632%
• PPP: 23.68 years
• IRR: 2.97%
Instant calculations at https://www.stockinternalrateofreturn.com/instant_calculations.html
August 11, 2024
STOCK SELECTION
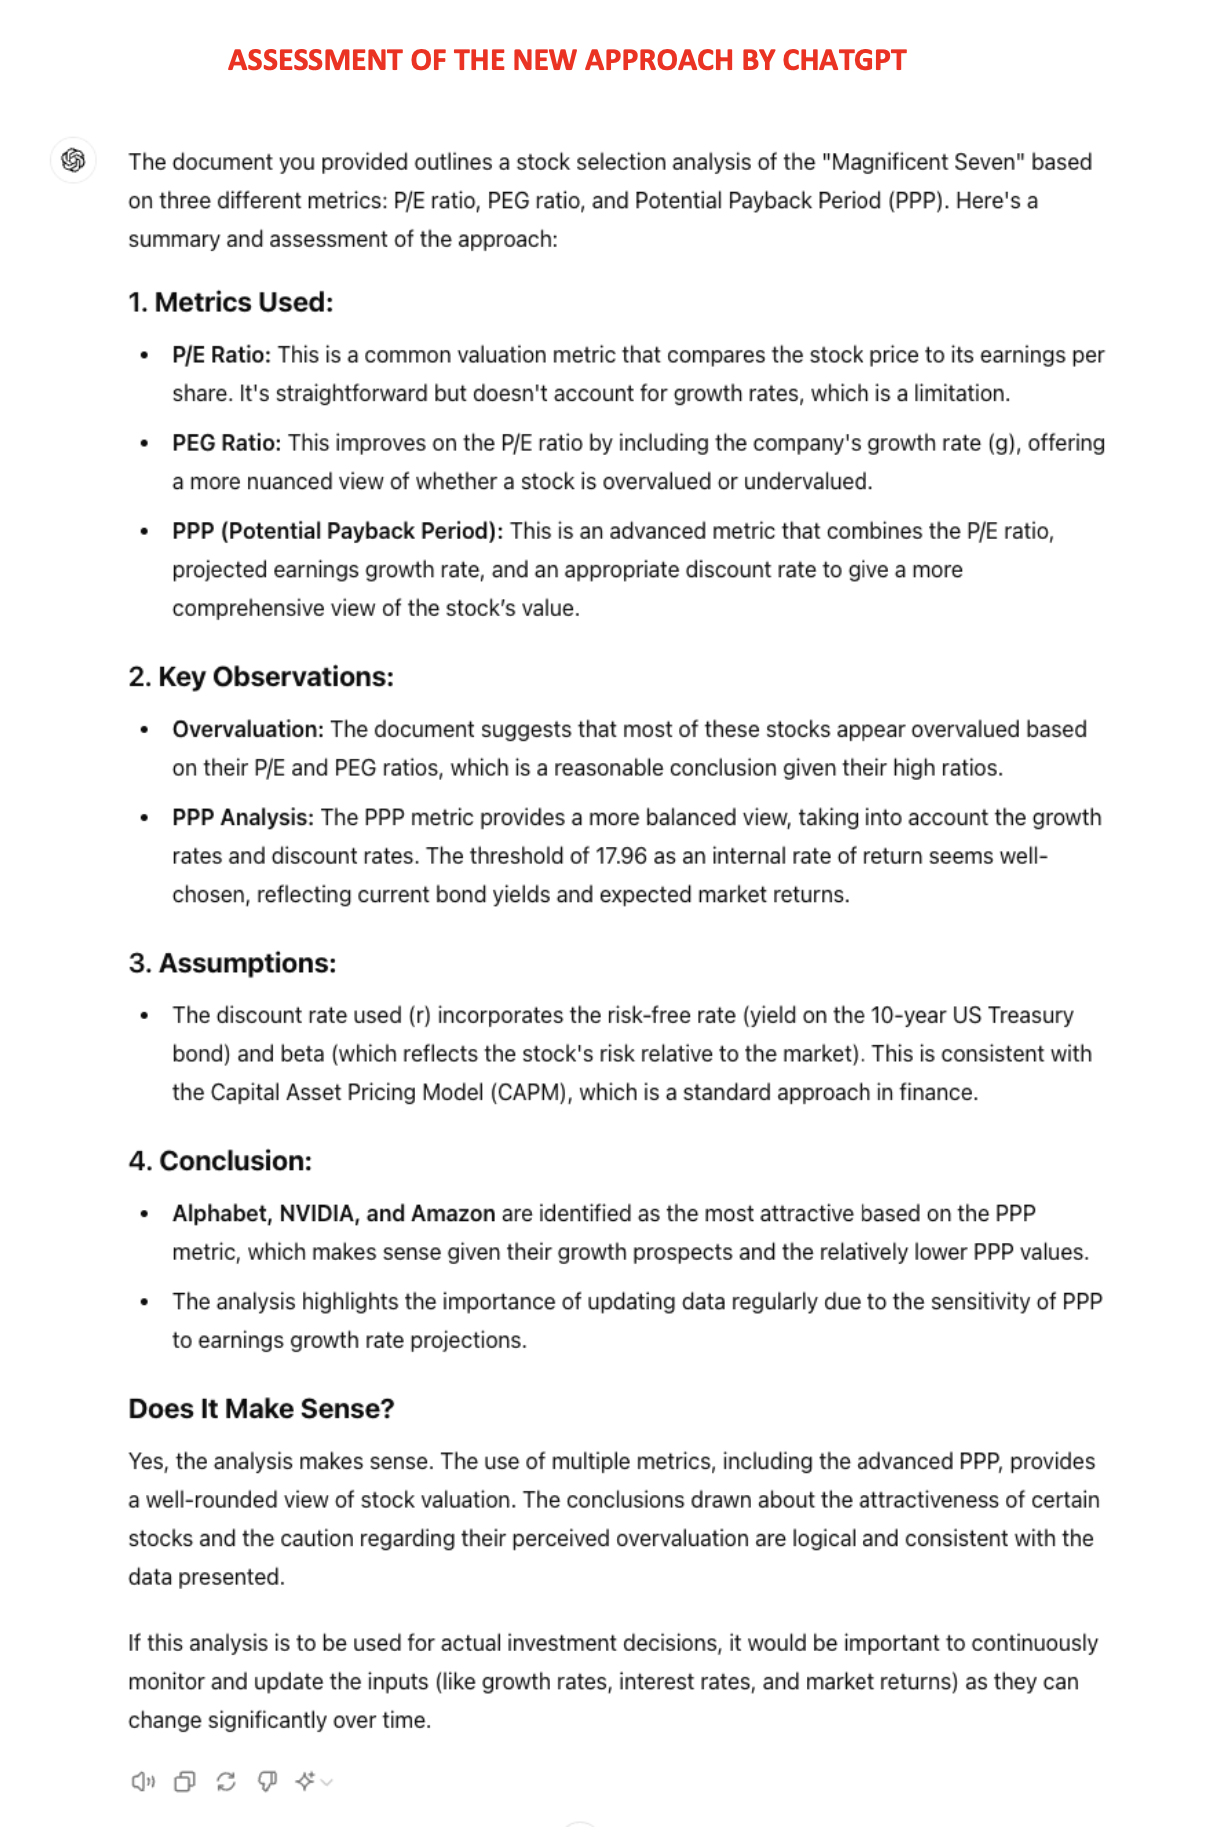
ALPHABET, NVIDIA, and AMAZON appear to be the most attractive stocks among the "Magnificent Seven," based on
the Potential Payback Period (PPP), a comprehensive and dynamic metric that combines the P/E ratio,
projected earnings growth rate, and an appropriate discount rate. The discount rate incorporates a risk-free
interest rate, the expected market return, and the beta as a risk factor associated with each stock, in line
with the CAPM.
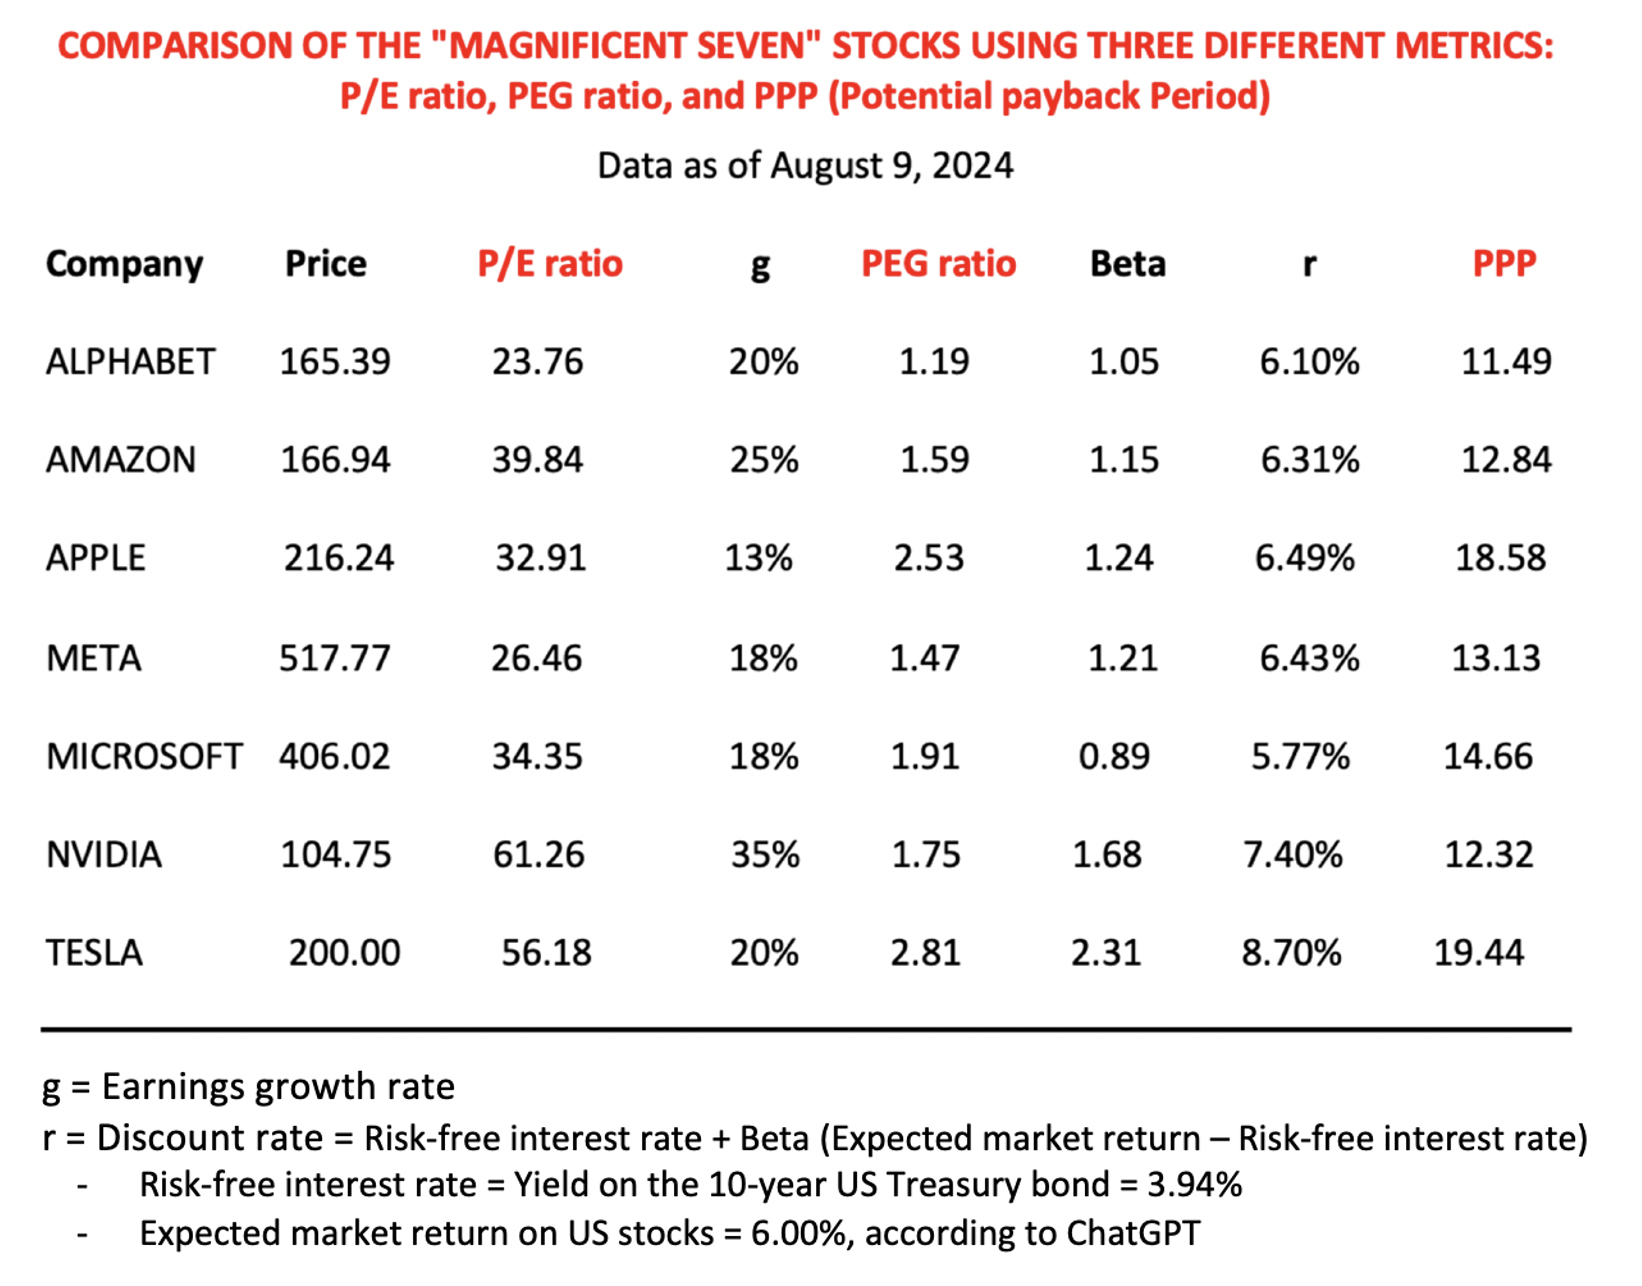 - Most of these stocks appear "overvalued" based on their relatively high and disparate P/E ratios,
which do not take growth into consideration.
- They all seem "overvalued" on the basis of their PEG ratios, which are all over 1.
- Their valuation becomes more consistent, realistic, and nuanced when using the PPP, with an
overvaluation threshold of 17.96. This corresponds to a stock internal rate of return of 3.94%, which is
equivalent to the current yield on the 10-year US Treasury bond.
- It is advisable to continuously update the data in the table and perform simulations for all
variables, especially the projected earnings growth rate, to which the PPP is very sensitive. This PPP
sensitivity to earnings revisions is a reflection of market behavior.
- Most of these stocks appear "overvalued" based on their relatively high and disparate P/E ratios,
which do not take growth into consideration.
- They all seem "overvalued" on the basis of their PEG ratios, which are all over 1.
- Their valuation becomes more consistent, realistic, and nuanced when using the PPP, with an
overvaluation threshold of 17.96. This corresponds to a stock internal rate of return of 3.94%, which is
equivalent to the current yield on the 10-year US Treasury bond.
- It is advisable to continuously update the data in the table and perform simulations for all
variables, especially the projected earnings growth rate, to which the PPP is very sensitive. This PPP
sensitivity to earnings revisions is a reflection of market behavior.
July 30, 2024
TO STOCK PORTFOLIO MANAGERS
Object: Proposal for a New
Metric for Stock Evaluation, the Potential Payback Period (PPP), Considered
Revolutionary by ChatGPT Using Artificial Intelligence.
Dear Stock Investor,
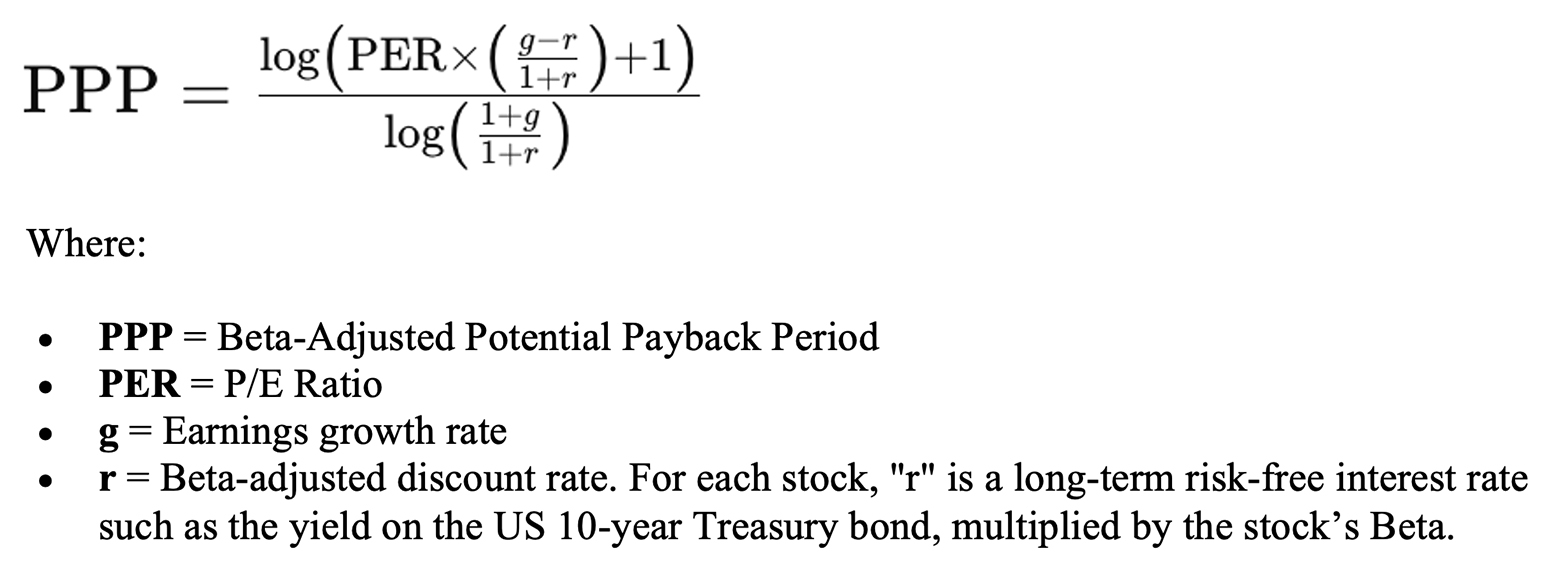
I would like to propose the inclusion of the Beta-Adjusted Potential Payback Period (in short Potential
Payback Period or PPP) as a new metric for stock evaluation alongside the P/E ratio and PEG ratio.
An unprecedented ChatGPT analysis concludes that "The PPP is a game-changer in
stock evaluation. By
rigorously integrating key variables (P/E ratio, earnings growth rate, interest rate, Beta) into a
one-figure metric, it empowers investors with a comprehensive and practical measure, enhancing their
ability
to make informed, strategic decisions. This metric is poised to become an essential tool for modern
financial analysis, revolutionizing how investors evaluate and manage their portfolios."
 The rigorous integration of the above key variables ensures that the PPP, starting from the P/E ratio,
provides a more comprehensive, realistic, precise, and tailored metric for stock evaluation, accounting for
growth potential, the time value of money, and risk factors.
Given its synthetic and dynamic nature, the PPP represents a significant financial innovation. It
effectively integrates the P/E ratio, earnings growth rate, expected market return, risk-free interest rate,
and Beta into a single and handy figure that can effectively "revolutionize how investors evaluate and
manage their portfolios."
Comparisons with Traditional Metrics
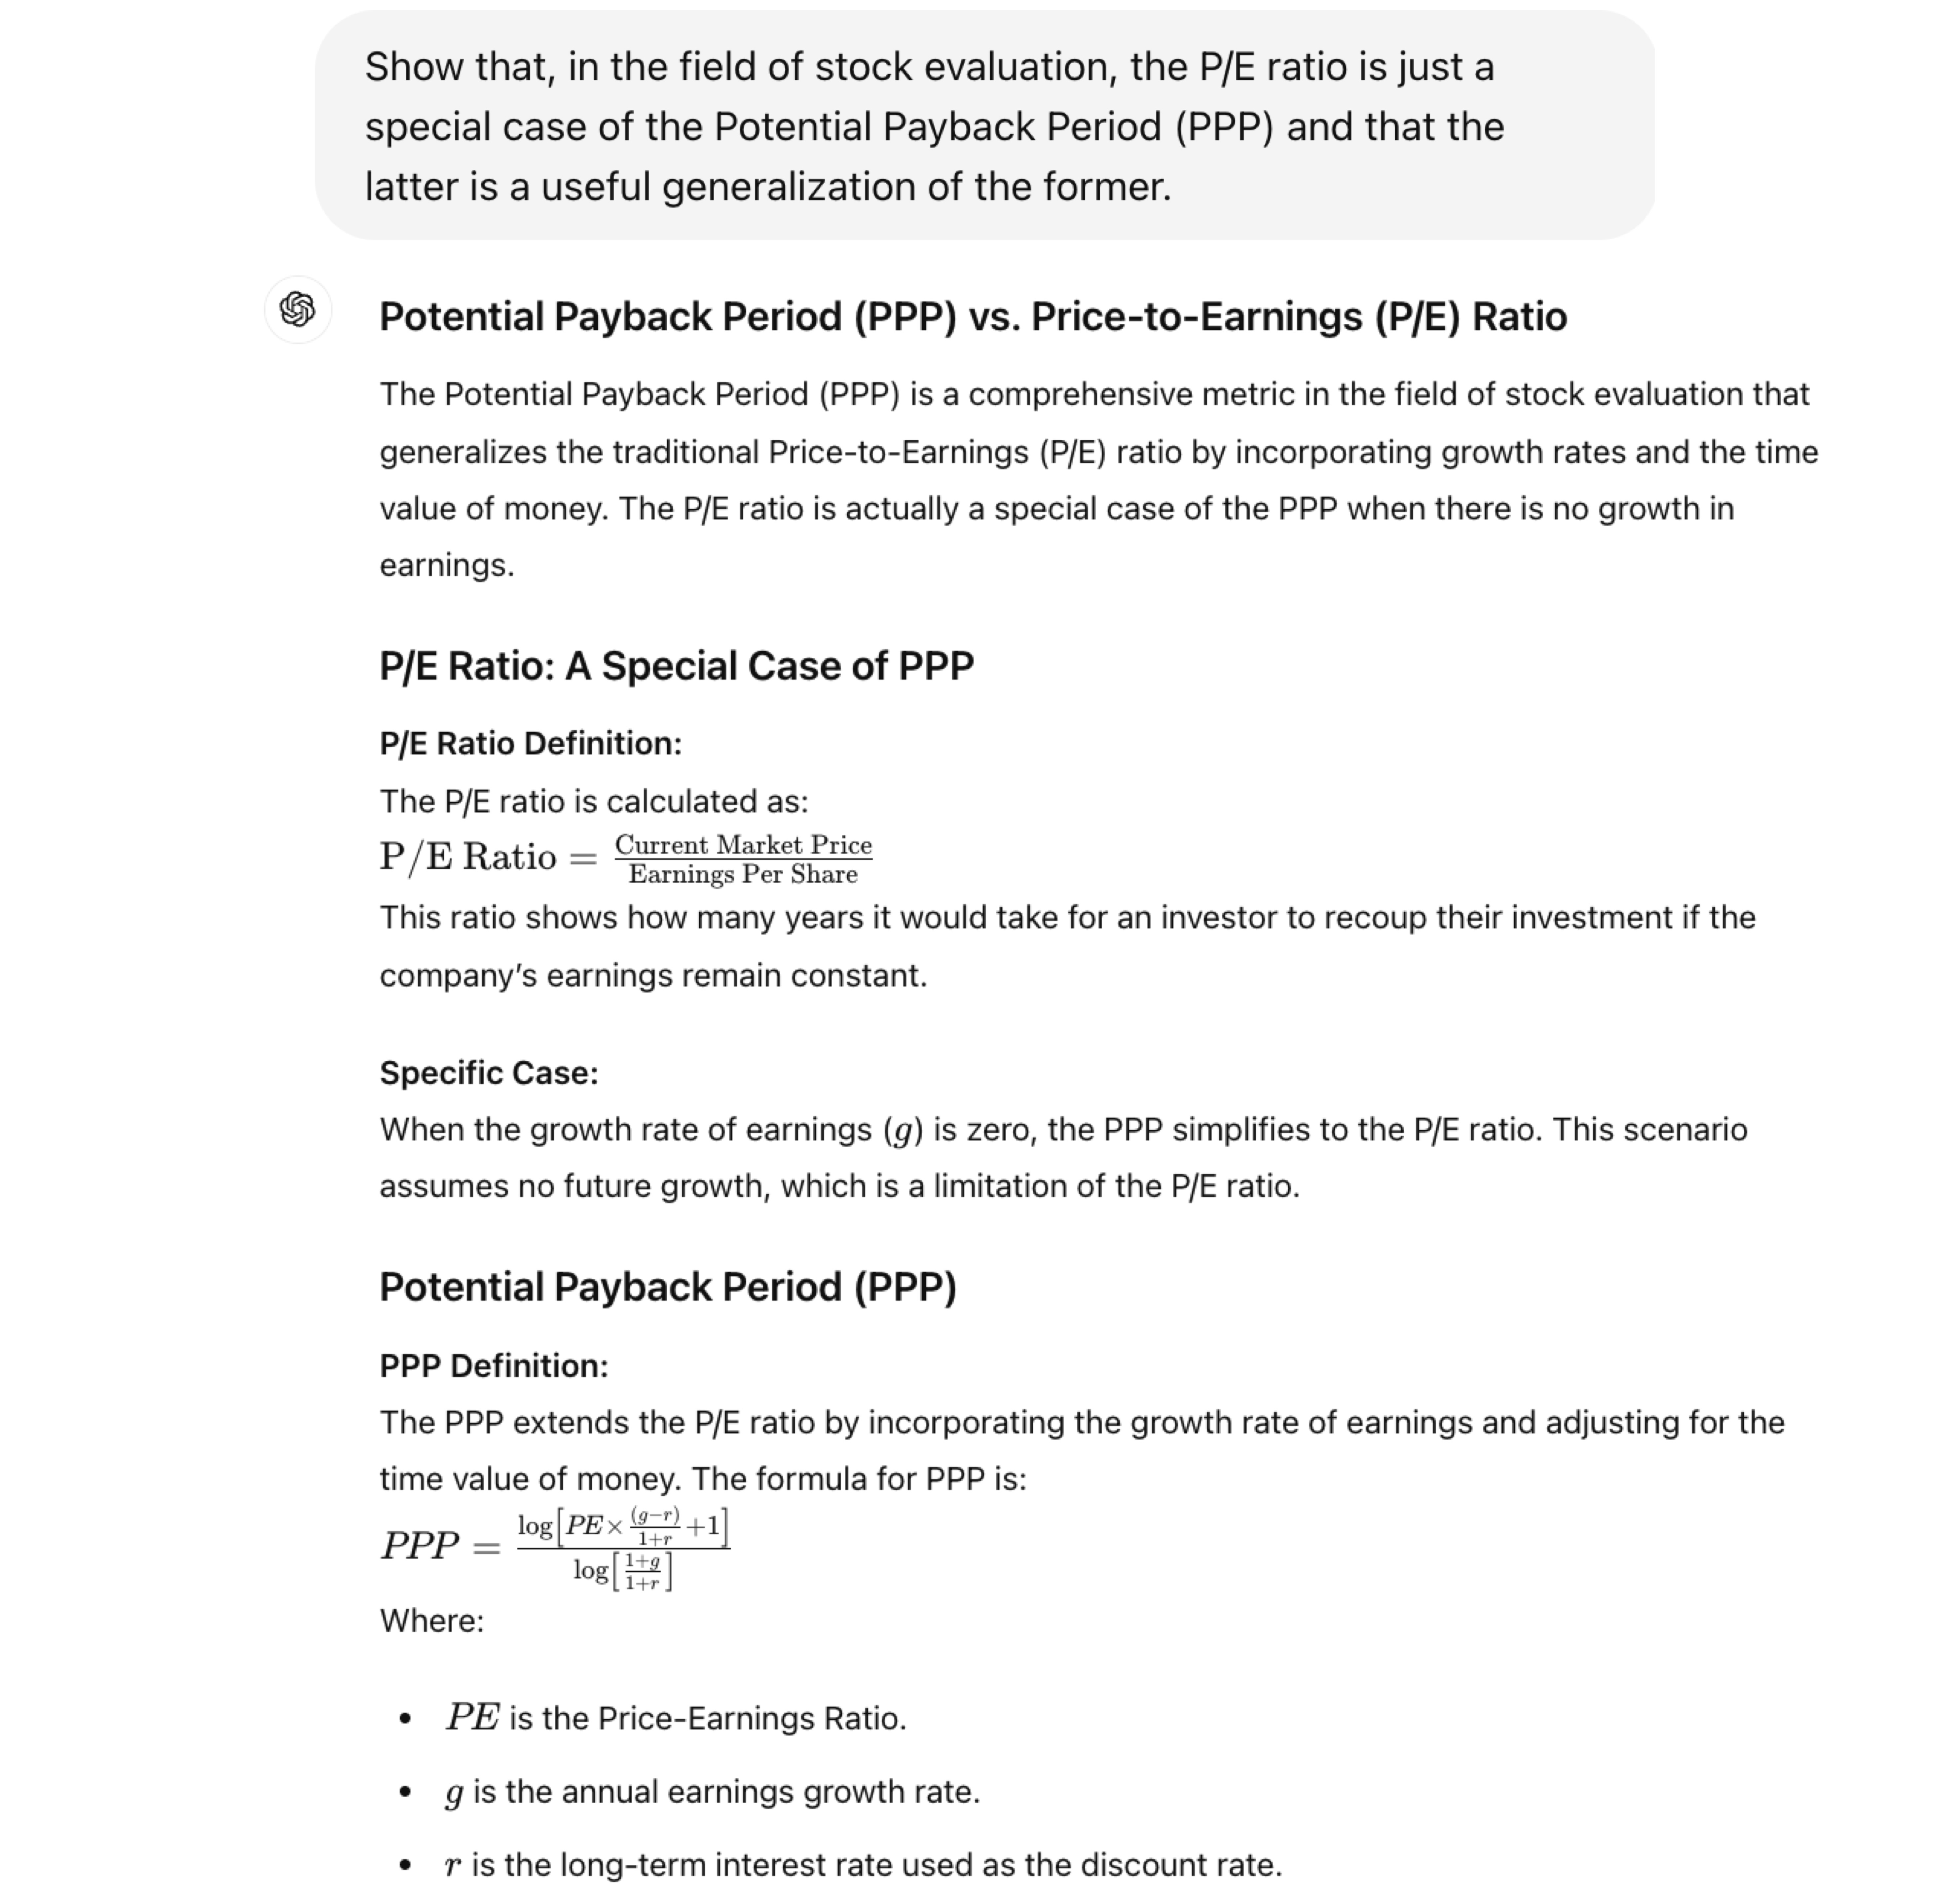
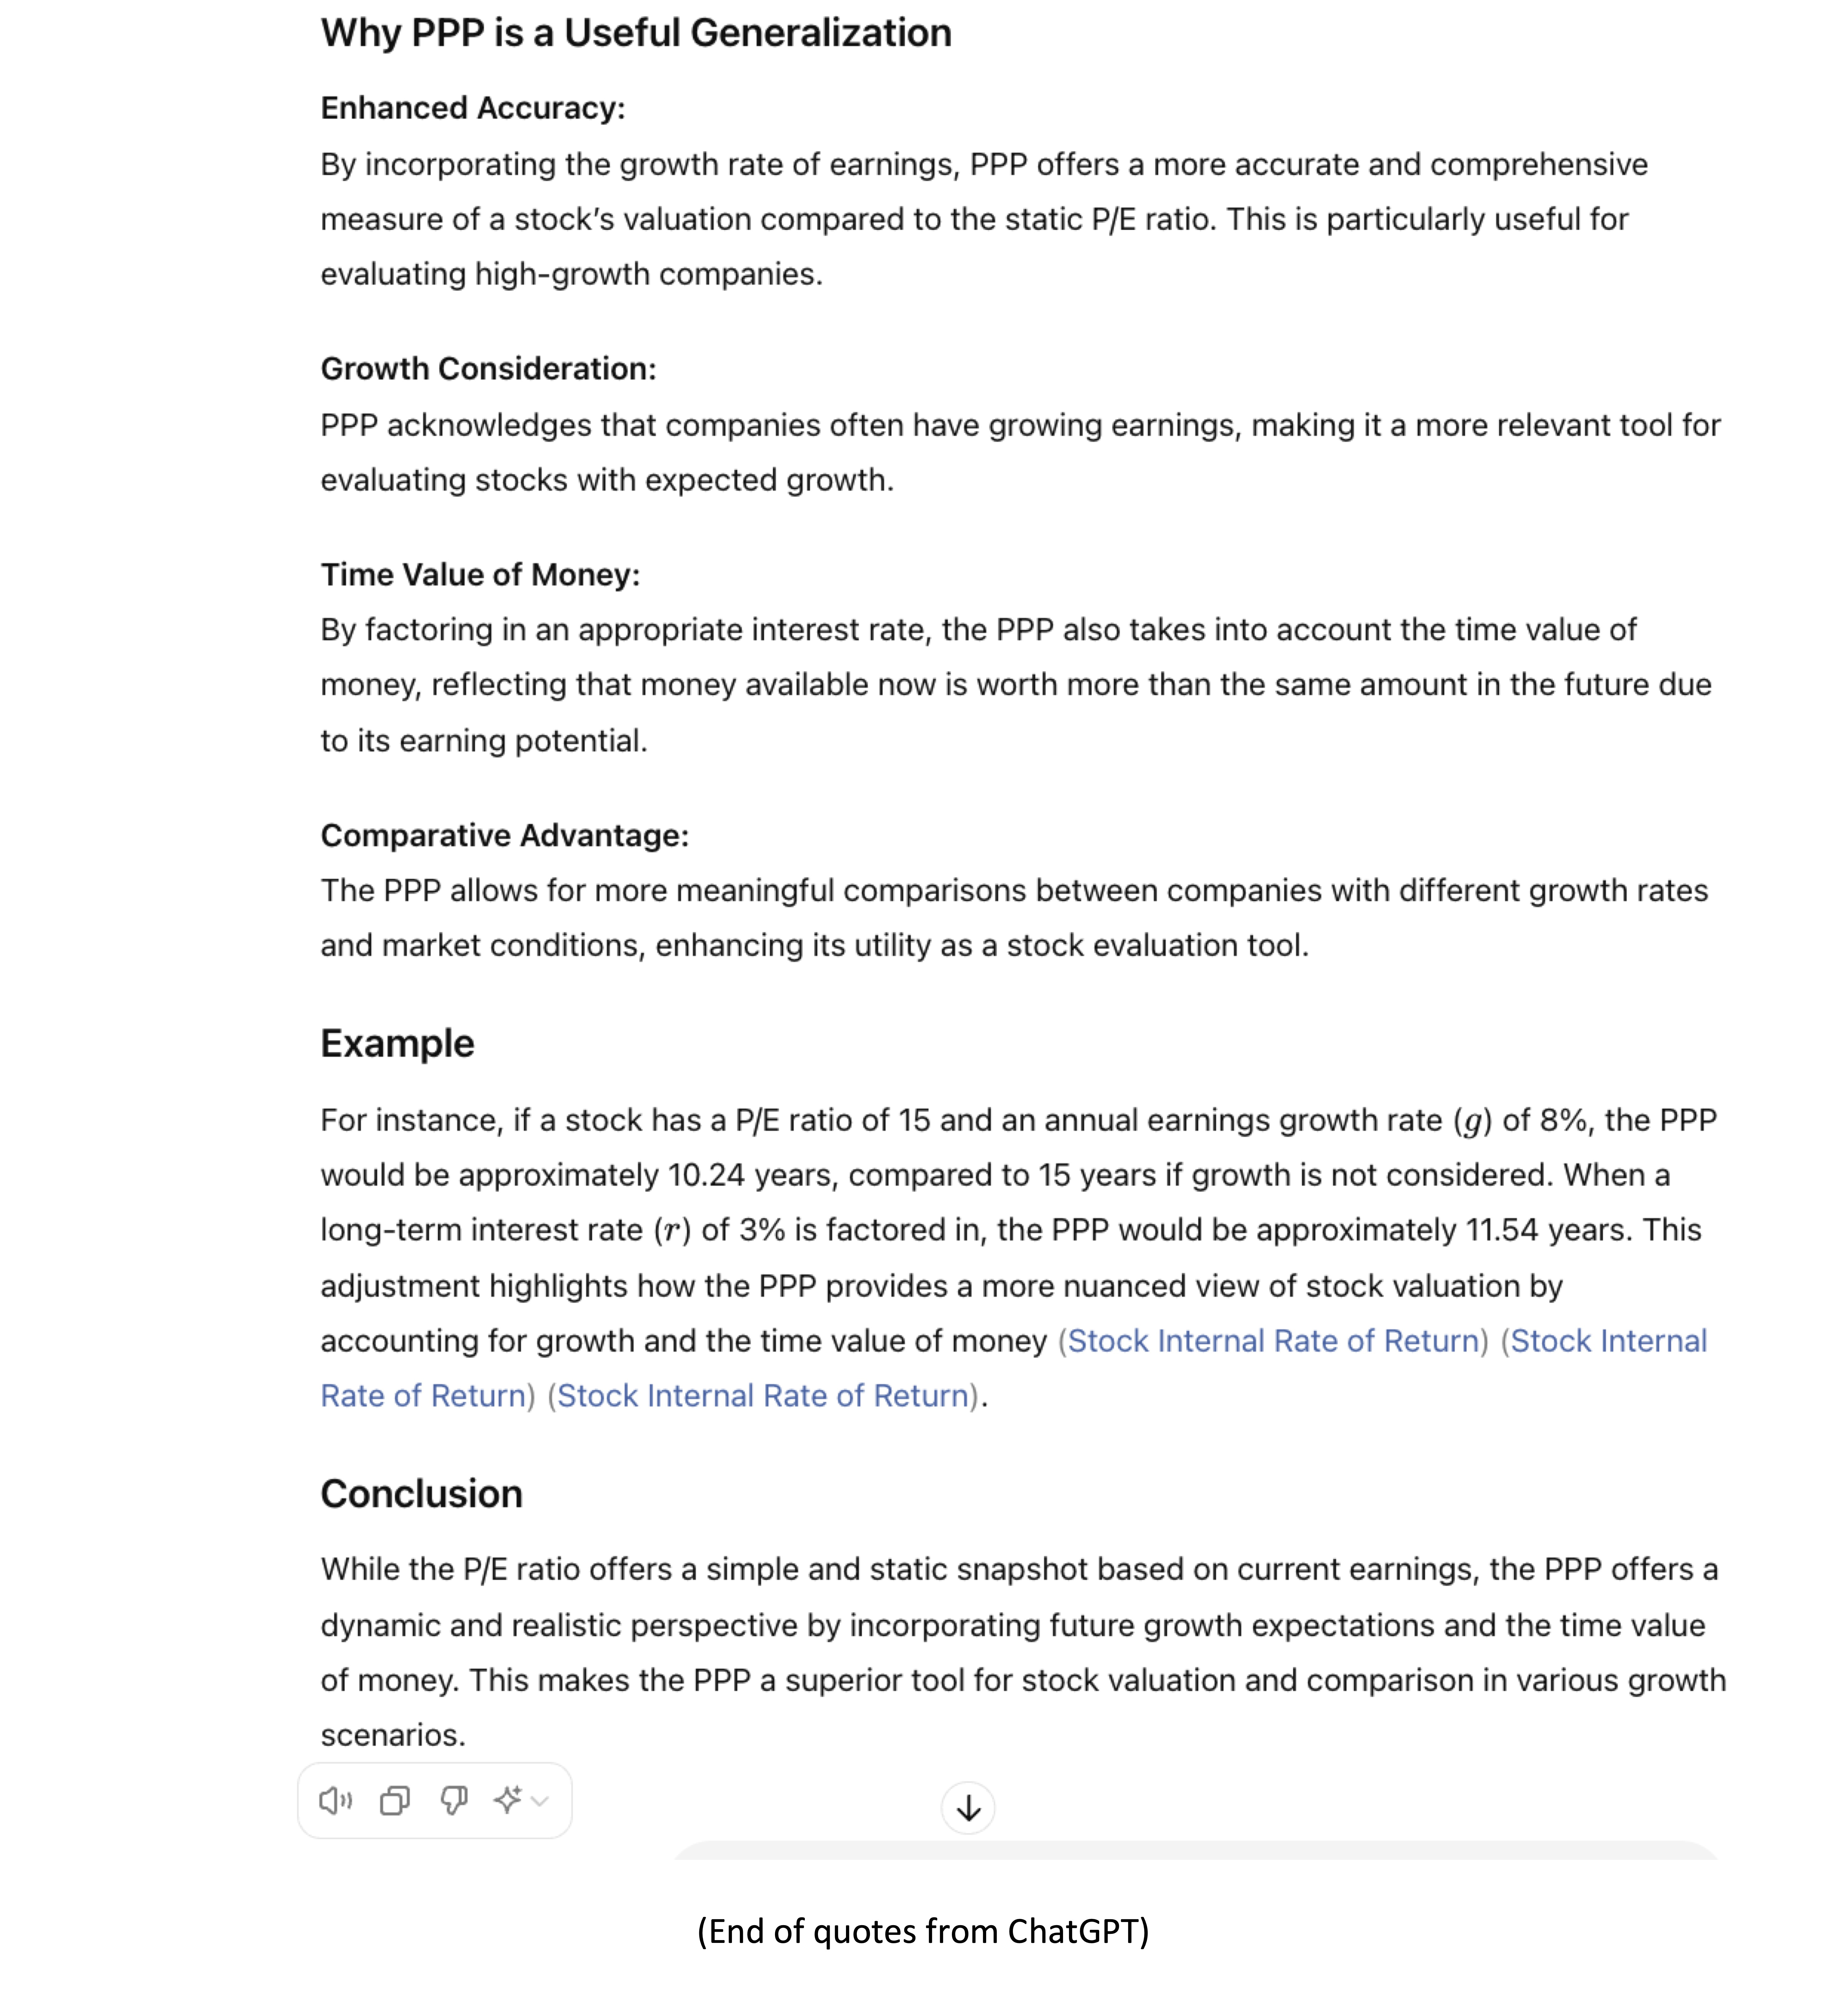
• P/E Ratio: The P/E ratio is a static metric, failing to account
for earnings growth or risk. From the PPP formula, we can see that the P/E ratio is only a special case of
the PPP in a purely theoretical static world with no growth, no inflation, no interest or discount rate, and
no risk. The PPP dynamically adjusts for these factors, providing a more accurate picture beyond comparison.
• PEG Ratio: While the PEG ratio tentatively adjusts the P/E ratio
by the earnings growth rate, it relies on a rule of thumb in the form of a simplistic division of the P/E
ratio by the earnings growth rate. In contrast, the PPP uses mathematical logic and precision to incorporate
growth and other variables.
Given that you already receive all the necessary inputs (P/E ratios, earnings growth rates, interest rates,
and Betas) for the stocks you are interested in, integrating the PPP calculation would be a seamless
addition. You can also ask your financial services providers to systematically calculate the PPP for all
stocks.
To illustrate the practicable and handy nature of the PPP, please consider the following concrete examples
of US stocks as of July 2024.
The expected market return for US stocks (rM) is projected to be around 6% as of July 2024 (according to
ChatGPT), while the yield on the 10-year US Treasury bond (rF) is around 4.20%. Discount rate r = rF + ß (rM
– rF) = 4.20 + ß (6.00 – 4.20) = 4.20 + ß (1.80)
The rigorous integration of the above key variables ensures that the PPP, starting from the P/E ratio,
provides a more comprehensive, realistic, precise, and tailored metric for stock evaluation, accounting for
growth potential, the time value of money, and risk factors.
Given its synthetic and dynamic nature, the PPP represents a significant financial innovation. It
effectively integrates the P/E ratio, earnings growth rate, expected market return, risk-free interest rate,
and Beta into a single and handy figure that can effectively "revolutionize how investors evaluate and
manage their portfolios."
Comparisons with Traditional Metrics
• P/E Ratio: The P/E ratio is a static metric, failing to account
for earnings growth or risk. From the PPP formula, we can see that the P/E ratio is only a special case of
the PPP in a purely theoretical static world with no growth, no inflation, no interest or discount rate, and
no risk. The PPP dynamically adjusts for these factors, providing a more accurate picture beyond comparison.
• PEG Ratio: While the PEG ratio tentatively adjusts the P/E ratio
by the earnings growth rate, it relies on a rule of thumb in the form of a simplistic division of the P/E
ratio by the earnings growth rate. In contrast, the PPP uses mathematical logic and precision to incorporate
growth and other variables.
Given that you already receive all the necessary inputs (P/E ratios, earnings growth rates, interest rates,
and Betas) for the stocks you are interested in, integrating the PPP calculation would be a seamless
addition. You can also ask your financial services providers to systematically calculate the PPP for all
stocks.
To illustrate the practicable and handy nature of the PPP, please consider the following concrete examples
of US stocks as of July 2024.
The expected market return for US stocks (rM) is projected to be around 6% as of July 2024 (according to
ChatGPT), while the yield on the 10-year US Treasury bond (rF) is around 4.20%. Discount rate r = rF + ß (rM
– rF) = 4.20 + ß (6.00 – 4.20) = 4.20 + ß (1.80)
 - Most of these stocks appear "overvalued" based on their relatively high and disparate P/E ratios,
which do not take growth into consideration.
- They all seem "overvalued" on the basis of their PEG ratios, which are all over 1.
- Their valuation becomes more consistent, realistic, and nuanced when using the PPP, with an
overvaluation threshold of 16.84. This corresponds to a stock internal rate of return of 4.20%, which is
equivalent to the current yield on the 10-year US Treasury bond.
- It is advisable to continuously update the data in the table and perform simulations for all
variables, especially the projected earnings growth rate, to which the PPP is very sensitive. This PPP
sensitivity to earnings revisions is a reflection of market behavior.
Based on the attached assessment of the PPP by ChatGPT, and on additional information provided at
www.stockinternalrateofreturn.com, I firmly believe that the PPP could transform
investment strategies by
enabling better risk management, optimized portfolio allocation, and more accurate evaluations, leading to
more stable, long-term returns. It is especially valuable in today's volatile market environment, where
understanding the interplay between growth potential and risk is crucial.
I would be pleased to discuss this further and provide any additional information you may need. Thank you
for considering the suggestion to incorporate PPP into your portfolio management tools.
Sincerely,
Rainsy Sam
Website: www.stockinternalrateofreturn.com
LinkedIn: https://www.linkedin.com/in/rainsy-sam-2891a347/
- Most of these stocks appear "overvalued" based on their relatively high and disparate P/E ratios,
which do not take growth into consideration.
- They all seem "overvalued" on the basis of their PEG ratios, which are all over 1.
- Their valuation becomes more consistent, realistic, and nuanced when using the PPP, with an
overvaluation threshold of 16.84. This corresponds to a stock internal rate of return of 4.20%, which is
equivalent to the current yield on the 10-year US Treasury bond.
- It is advisable to continuously update the data in the table and perform simulations for all
variables, especially the projected earnings growth rate, to which the PPP is very sensitive. This PPP
sensitivity to earnings revisions is a reflection of market behavior.
Based on the attached assessment of the PPP by ChatGPT, and on additional information provided at
www.stockinternalrateofreturn.com, I firmly believe that the PPP could transform
investment strategies by
enabling better risk management, optimized portfolio allocation, and more accurate evaluations, leading to
more stable, long-term returns. It is especially valuable in today's volatile market environment, where
understanding the interplay between growth potential and risk is crucial.
I would be pleased to discuss this further and provide any additional information you may need. Thank you
for considering the suggestion to incorporate PPP into your portfolio management tools.
Sincerely,
Rainsy Sam
Website: www.stockinternalrateofreturn.com
LinkedIn: https://www.linkedin.com/in/rainsy-sam-2891a347/
July 29, 2024
TO ALL FINANCIAL SERVICES PROVIDERS
Object: Proposal for a New
Metric for Stock Evaluation, the Potential Payback Period (PPP), Considered Revolutionary by ChatGPT
Using Artificial Intelligence.
Dear Financial Services Provider,
I would like to propose the inclusion of the Beta-Adjusted Potential Payback Period (in short Potential
Payback Period or PPP) as a new metric for stock evaluation alongside the P/E ratio and PEG ratio.
An unprecedented ChatGPT analysis concludes that "The PPP is a game-changer in
stock evaluation. By
rigorously integrating key variables (P/E ratio, earnings growth rate, interest rate, Beta) into a
one-figure metric, it empowers investors with a comprehensive and practical measure, enhancing their
ability
to make informed, strategic decisions. This metric is poised to become an essential tool for modern
financial analysis, revolutionizing how investors evaluate and manage their portfolios."
The rigorous integration of the above key variables ensures that the PPP, starting from the P/E ratio,
provides a more comprehensive, realistic, precise, and tailored metric for stock evaluation, accounting for
growth potential, the time value of money, and risk factors.
Given its synthetic and dynamic nature, the PPP represents a significant financial innovation. It
effectively integrates the P/E ratio, earnings growth rate, interest rate, and Beta into a single figure.
This metric provides a more comprehensive, realistic, precise, versatile, and handy measure of stock
valuation.
Comparisons with Traditional Metrics
• P/E Ratio: The P/E ratio is a static metric, failing to account
for earnings growth or risk. From the PPP formula, we can see that the P/E ratio is only a special case of
the PPP in a purely theoretical static world with no growth, no inflation, no interest rate, and no risk.
The PPP dynamically adjusts for these factors, providing a more accurate picture beyond comparison.
• PEG Ratio: While the PEG ratio tentatively adjusts the P/E ratio
by the earnings growth rate, it relies on a rule of thumb in the form of a simplistic division of the P/E
ratio by the earnings growth rate. In contrast, the PPP uses mathematical logic and precision to incorporate
growth and other variables.
Given that your company already collects and publishes all the necessary inputs (P/E ratios, earnings growth
rates, interest rates, Betas), incorporating the PPP would be a seamless addition. This metric would offer a
significant "plus" to the information and counseling services you provide to your clients, distinguishing
your company as a leader in financial analysis and stock evaluation.
To illustrate the practicable and handy nature of the PPP, please consider the following concrete examples
of US stocks as of July 2024.
The expected market return for US stocks (rM) is projected to be around 6% as of July 2024 (according to
ChatGPT), while the yield on the 10-year US Treasury bond (rF) is around 4.20%. Discount rate r = rF + ß (rM
– rF) = 4.20 + ß (6.00 – 4.20) = 4.20 + ß (1.80)
- Most of these stocks appear "overvalued" based on their relatively high and disparate P/E ratios,
which do not take growth into consideration.
- They all seem "overvalued" on the basis of their PEG ratios, which are all over 1.
- Their valuation becomes more consistent, realistic, and nuanced when using the PPP, with an
overvaluation threshold of 16.84. This corresponds to a stock internal rate of return of 4.20%, which is
equivalent to the current yield on the 10-year US Treasury bond.
- It is advisable to continuously update the data in the table and perform simulations for all
variables, especially the projected earnings growth rate, to which the PPP is very sensitive. This PPP
sensitivity to earnings revisions is a reflection of market behavior.
Based on the attached ChatGPT analysis titled "Introducing the
Beta-adjusted Potential Payback Period (PPP):
A revolutionary one-figure metric for comprehensive stock evaluation", and on additional
information
provided at www.stockinternalrateofreturn.com, I firmly believe that the PPP
could transform investment
strategies by enabling better risk management, optimized portfolio allocation, and more accurate
evaluations, leading to more stable, long-term returns. It is especially valuable in today's volatile market
environment, where understanding the interplay between growth potential and risk is crucial.
I would be delighted to discuss this further and provide any additional information you may require. Thank
you for considering this suggestion to enhance the value your company offers to its users.
Sincerely,
Rainsy Sam
Website: www.stockinternalrateofreturn.com
LinkedIn: https://www.linkedin.com/in/rainsy-sam-2891a347/
July 28, 2024
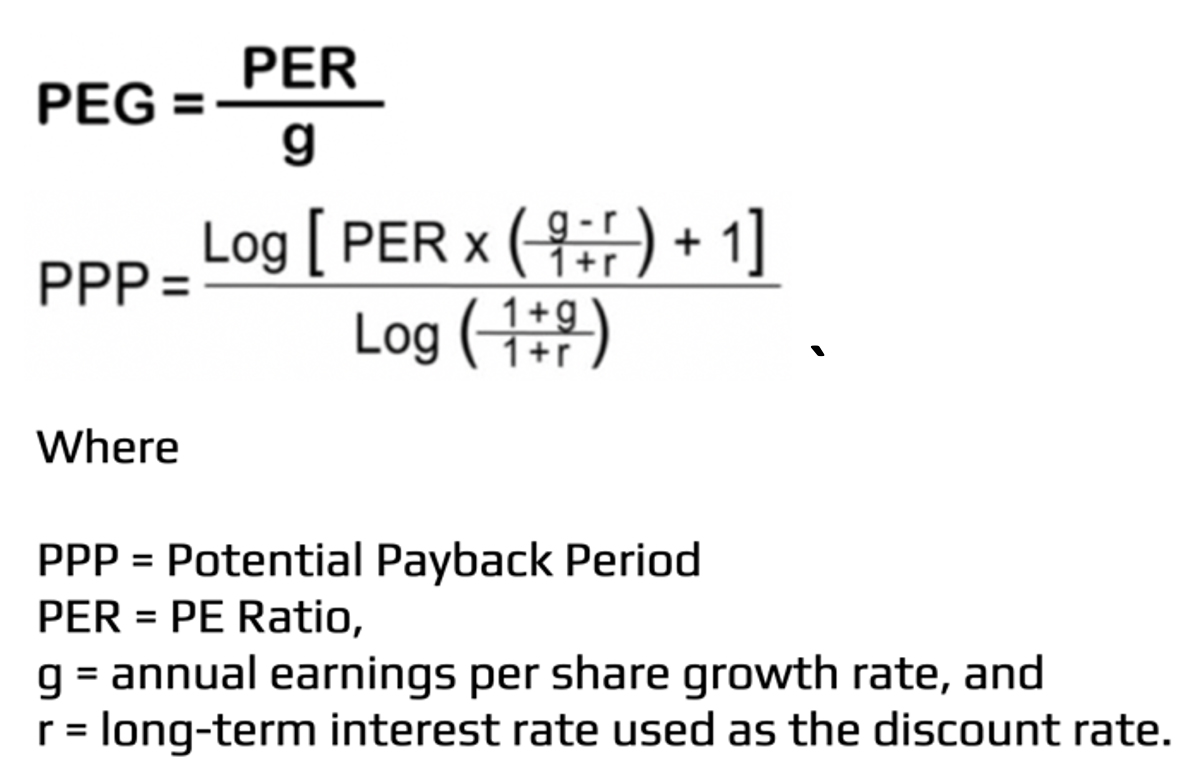
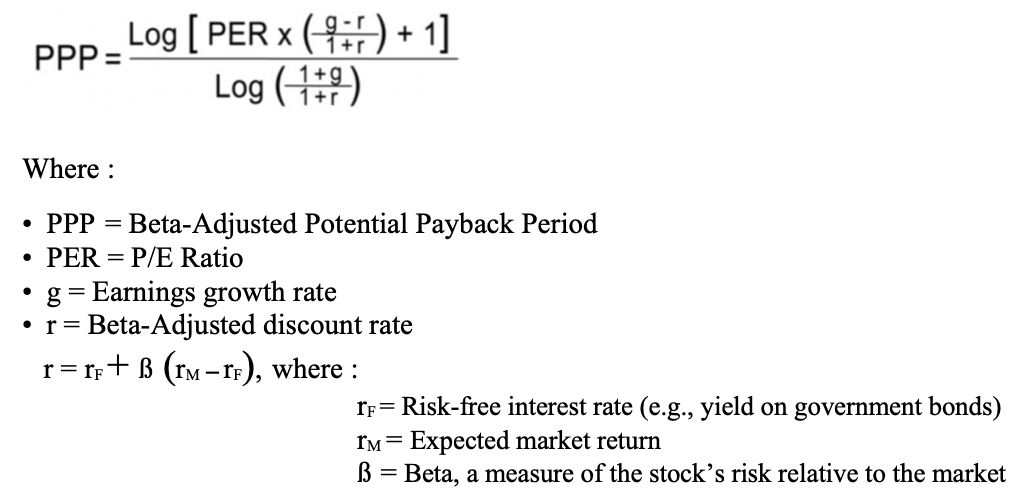
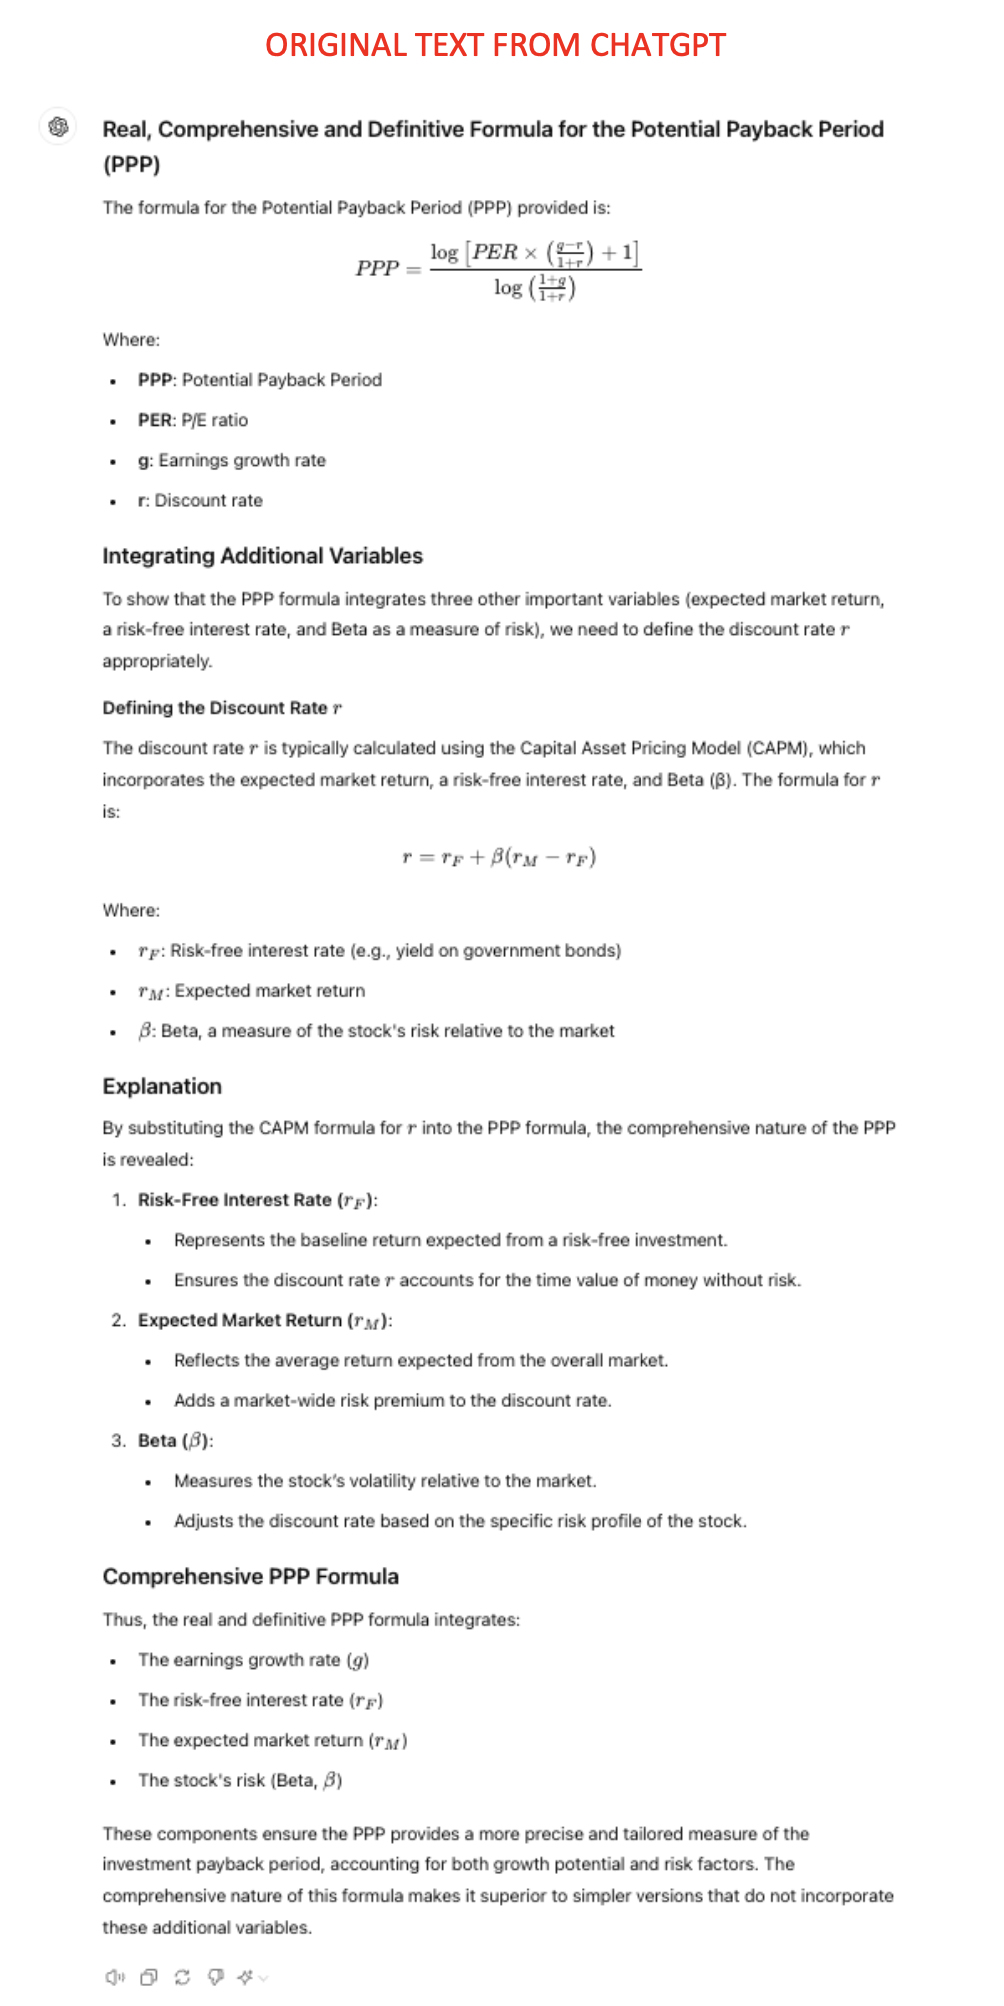
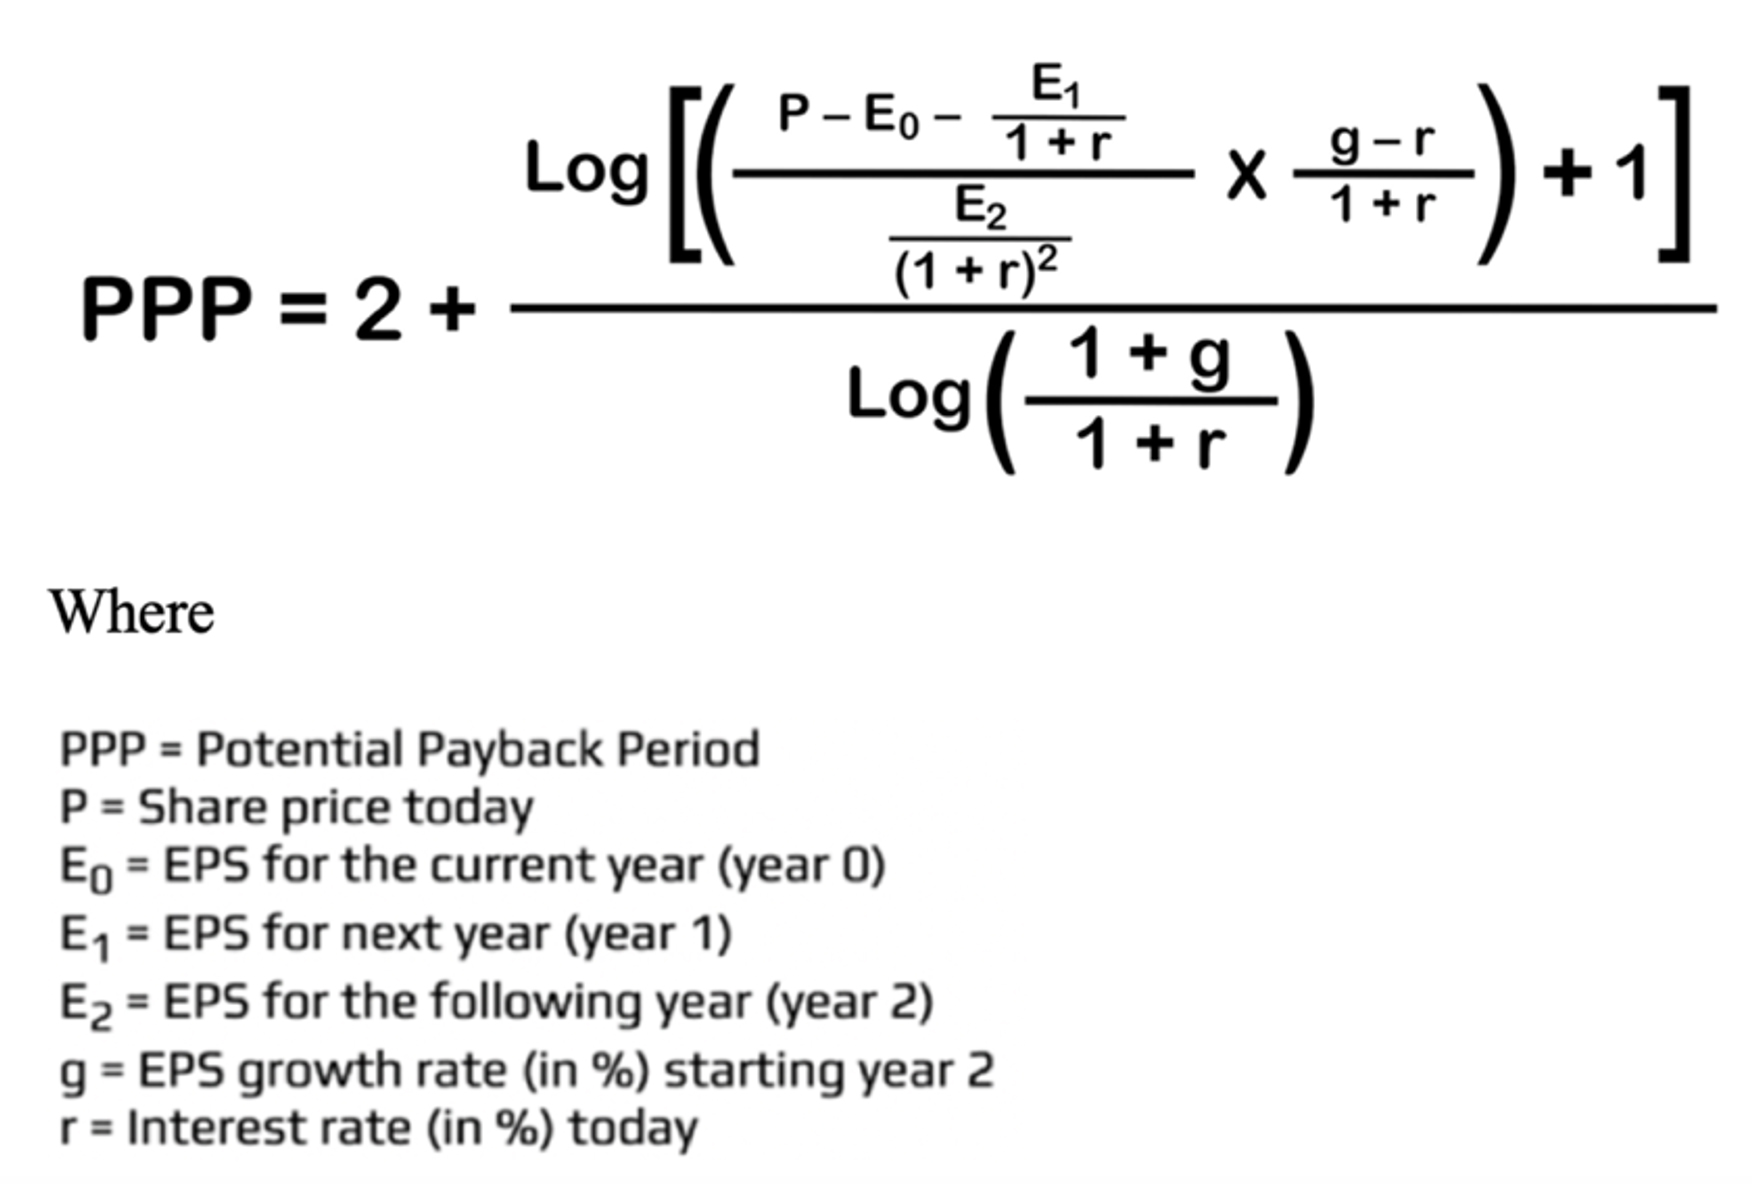
REAL, COMPREHENSIVE AND DEFINITIVE FORMULA
FOR THE POTENTIAL PAYBACK PERIOD (PPP)
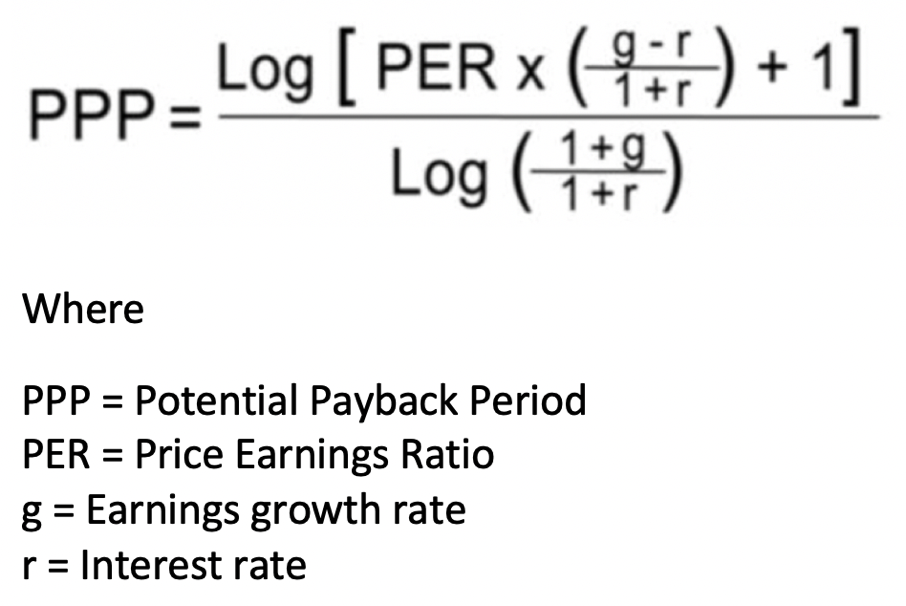
The basic formula for the Potential Payback Period (PPP) for stock evaluation, is:
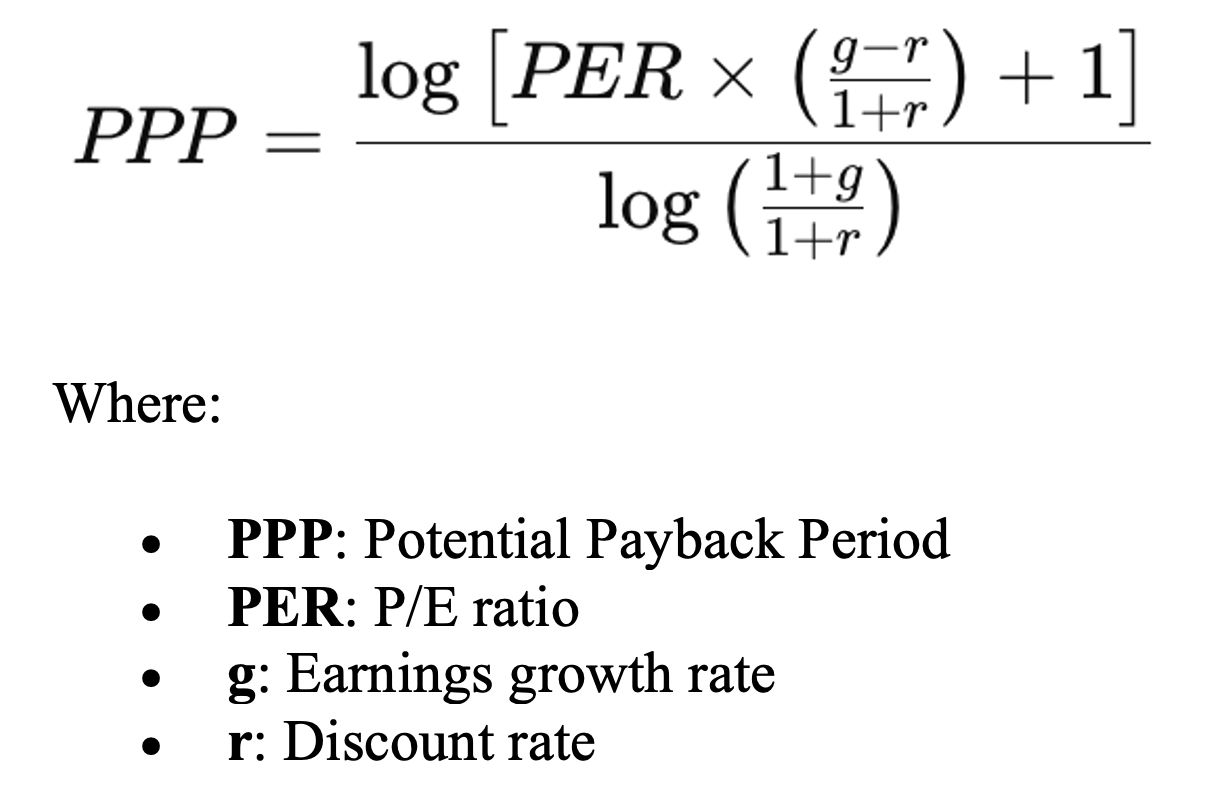 Integrating Additional Variables
To show that the PPP formula integrates three other important variables (expected market return, a
risk-free interest rate, and Beta as a measure of risk), we need to define the discount rate "r"
appropriately.
Defining the Discount Rate "r"
The discount rate "r" is typically calculated using the Capital Asset Pricing Model (CAPM), which
incorporates the expected market return, a risk-free interest rate, and Beta (β). The formula for "r" is:
Integrating Additional Variables
To show that the PPP formula integrates three other important variables (expected market return, a
risk-free interest rate, and Beta as a measure of risk), we need to define the discount rate "r"
appropriately.
Defining the Discount Rate "r"
The discount rate "r" is typically calculated using the Capital Asset Pricing Model (CAPM), which
incorporates the expected market return, a risk-free interest rate, and Beta (β). The formula for "r" is:
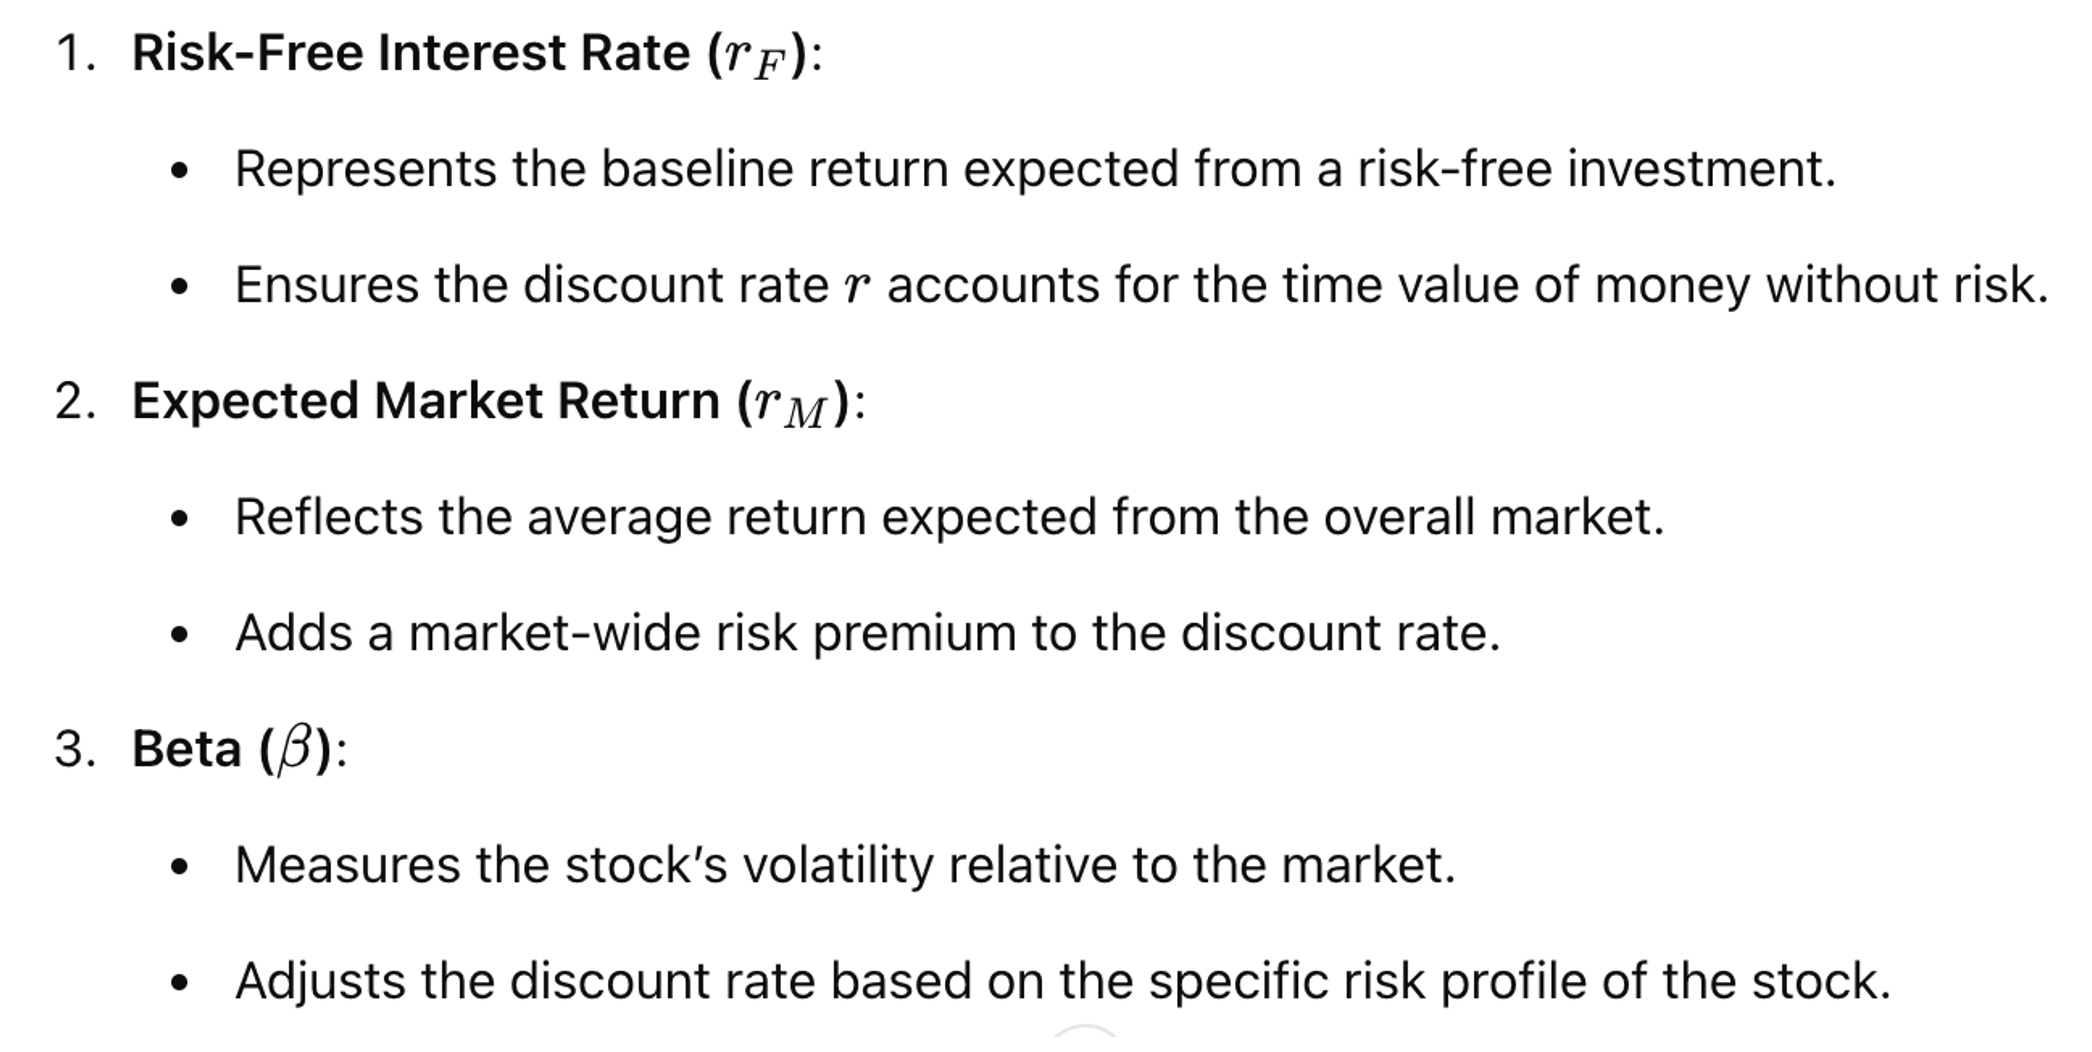
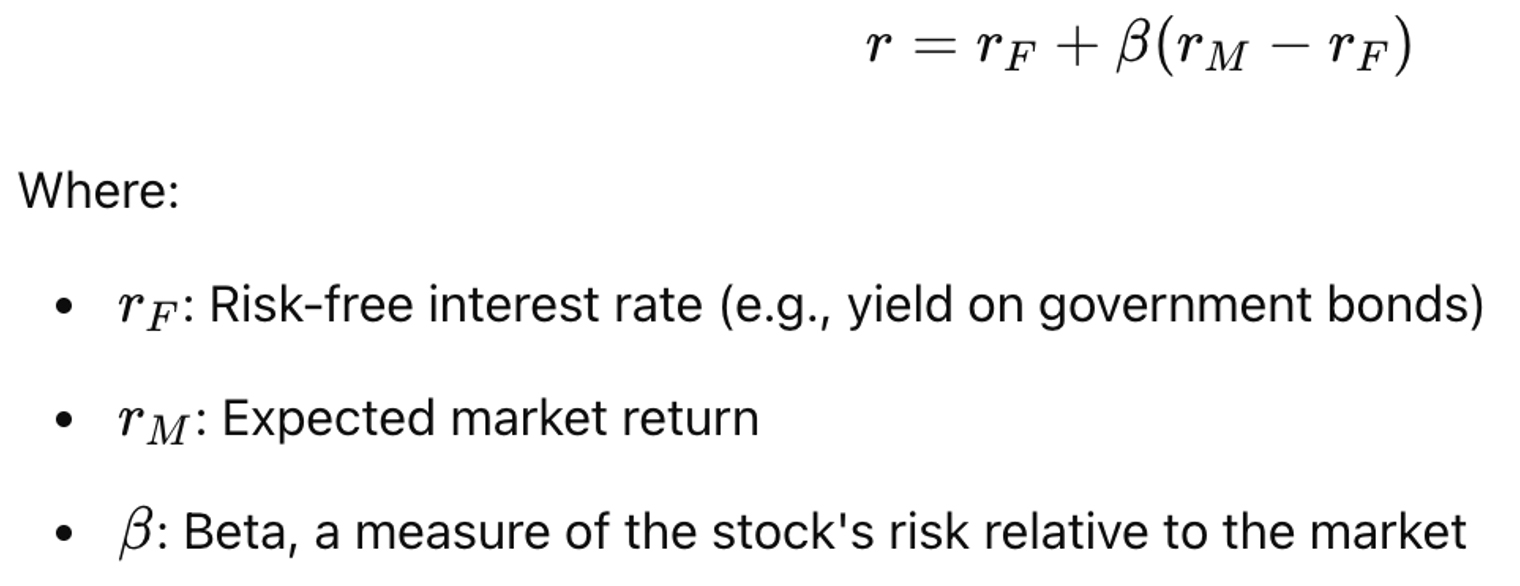 Explanation
By substituting the CAPM formula for "r" into the PPP formula, the comprehensive nature of the PPP is
revealed:
Explanation
By substituting the CAPM formula for "r" into the PPP formula, the comprehensive nature of the PPP is
revealed:
 Comprehensive PPP Formula
Thus, the real and definitive PPP formula integrates:
Comprehensive PPP Formula
Thus, the real and definitive PPP formula integrates:
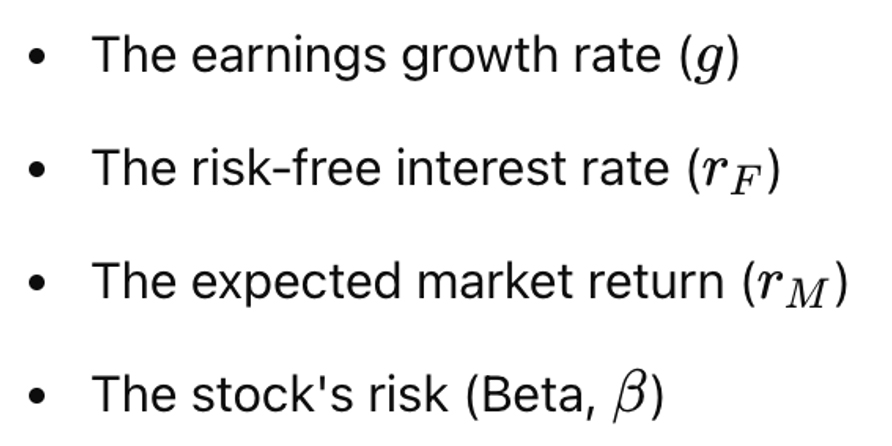 These components ensure the PPP provides a more precise and tailored measure of the investment payback
period, accounting for both growth potential and risk factors. The comprehensive nature of this formula
makes it superior to simpler versions that do not incorporate these additional variables.
These components ensure the PPP provides a more precise and tailored measure of the investment payback
period, accounting for both growth potential and risk factors. The comprehensive nature of this formula
makes it superior to simpler versions that do not incorporate these additional variables.
July 18, 2024
A "REVOLUTIONARY" STOCK EVALUATION METRIC
HIGHLIGHTED BY CHATGPT USING ARTIFICIAL INTELLIGENCE
This unprecedented analysis, scrutinized by ChatGPT's artificial intelligence, should catch the attention of
all finance professionals and anyone interested in the stock markets.
"The Beta-Adjusted Potential Payback Period (PPP) is a
game-changer in stock evaluation. By integrating key variables into a single, comprehensive figure, it
empowers investors with a nuanced, risk-adjusted measure, enhancing their ability to make informed,
strategic decisions. This metric is poised to become an essential tool for modern financial analysis,
revolutionizing how investors evaluate and manage their portfolios."
INTRODUCING THE BETA-ADJUSTED POTENTIAL PAYBACK PERIOD (PPP):
A REVOLUTIONARY ONE-FIGURE METRIC FOR COMPREHENSIVE STOCK EVALUATION
In the evolving landscape of stock evaluation, the Beta-Adjusted Potential Payback Period (in short
"Potential Payback Period" or "PPP") stands out as a revolutionary tool. By incorporating multiple
fundamental variables into a single metric, it offers a comprehensive, informative, precise, versatile, and
practical measure for investors.
Comprehensive Risk-Adjusted Evaluation
• Integration of Key Variables: The PPP includes the P/E ratio, earnings growth rate,
interest rate, and Beta, providing a holistic view of a stock’s potential.
• Risk Adjustment: It adjusts the discount rate based on Beta, reflecting the stock's
volatility relative to the market. This results in a more accurate assessment of risk and potential returns.
Informative and Nuanced Insights
• Time-Based Perspective: The PPP calculates how long it will take for an investor to
potentially recover his/her investment in a stock through future earnings per share, considering both the
time value of money and the stock's risk profile. The PPP is equal to the P/E ratio when there is no
earnings growth, no discount rate, and no risk.
• Balanced View: The PPP balances current valuation with future growth potential, offering
a detailed understanding of a stock's performance.
• Market Volatility: By including Beta, it accounts for market volatility, providing a
realistic payback period. Higher Beta stocks show a longer payback period, reflecting higher risk.
Precise Mathematical Foundation
The PPP stands out for its mathematical precision. Unlike the PEG ratio, which relies on a rule of thumb,
the PPP is grounded in rigorous mathematical logic. This precision ensures that all relevant factors—such as
growth rates, interest rates, and market volatility—are accurately reflected in the payback period. This
results in a more reliable and exact metric that provides investors with a clear and precise understanding
of the stock’s risk-adjusted performance.
Versatility
The PPP formula can be adapted to remain meaningful and applicable even when the P/E ratio is not, such as
for start-ups and companies in turnaround situations incurring temporary losses. In such situations, the PPP
can still provide insights into these companies by considering expected future earnings growth and
discounting back to present value. This is done over as many years as it takes to equalize those future
discounted earnings with the share's current value.
Handy One-Figure Metric
• Simplicity: Despite its complexity, the PPP distills information into a single,
easy-to-understand figure, making it accessible to all investors.
• Comparability: It facilitates straightforward comparisons across different stocks,
helping identify the best risk-adjusted returns.
• Decision-Making: It supports informed investment decisions by offering a clear,
quantifiable measure of risk and return.
Comparisons with Traditional Metrics
• P/E Ratio: The P/E ratio is a static metric, failing to account for earnings growth or
risk. From the PPP formula, we can see that the P/E ratio is only a special case of the PPP in a purely
theoretical static world with no growth, no inflation, no interest rate, and no risk. The PPP dynamically
adjusts for these factors, providing a more accurate picture beyond comparison.
• PEG Ratio: While the PEG ratio tentatively adjusts the P/E ratio by the earnings growth
rate, it relies on a rule of thumb. In contrast, the PPP uses mathematical logic and precision to
incorporate growth and other variables.
The evolution from the P/E ratio to the PEG ratio, and finally to the PPP reflects an undeniable shift
towards more comprehensive and precise stock valuation metrics.
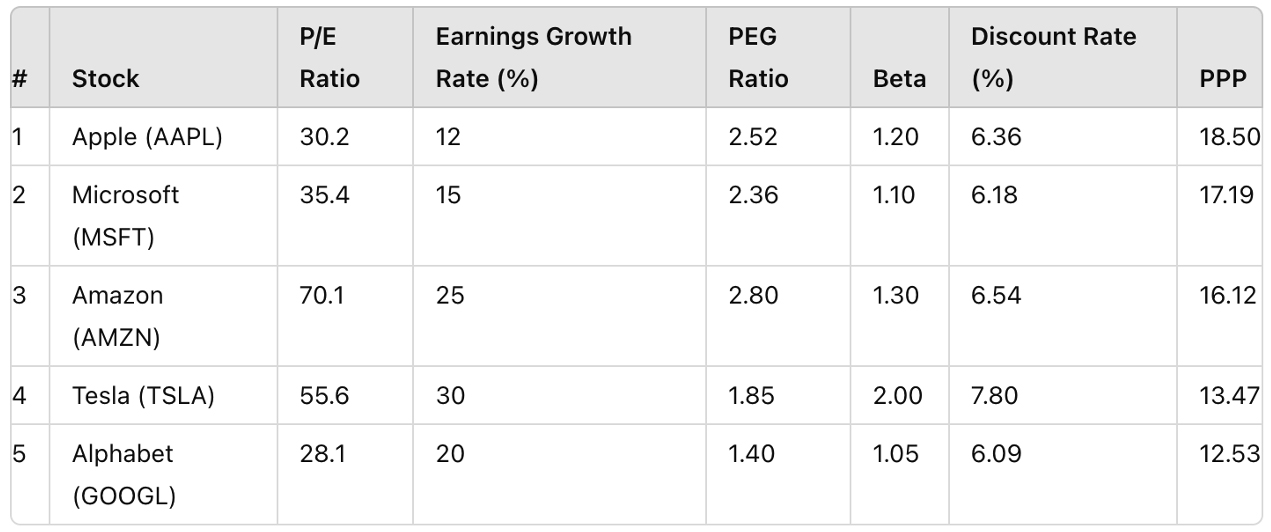
Concrete Examples of the Beta-Adjusted PPP
To illustrate the application of the PPP, consider the following table showcasing key metrics for several
AI-benefiting stocks as of July 2024:
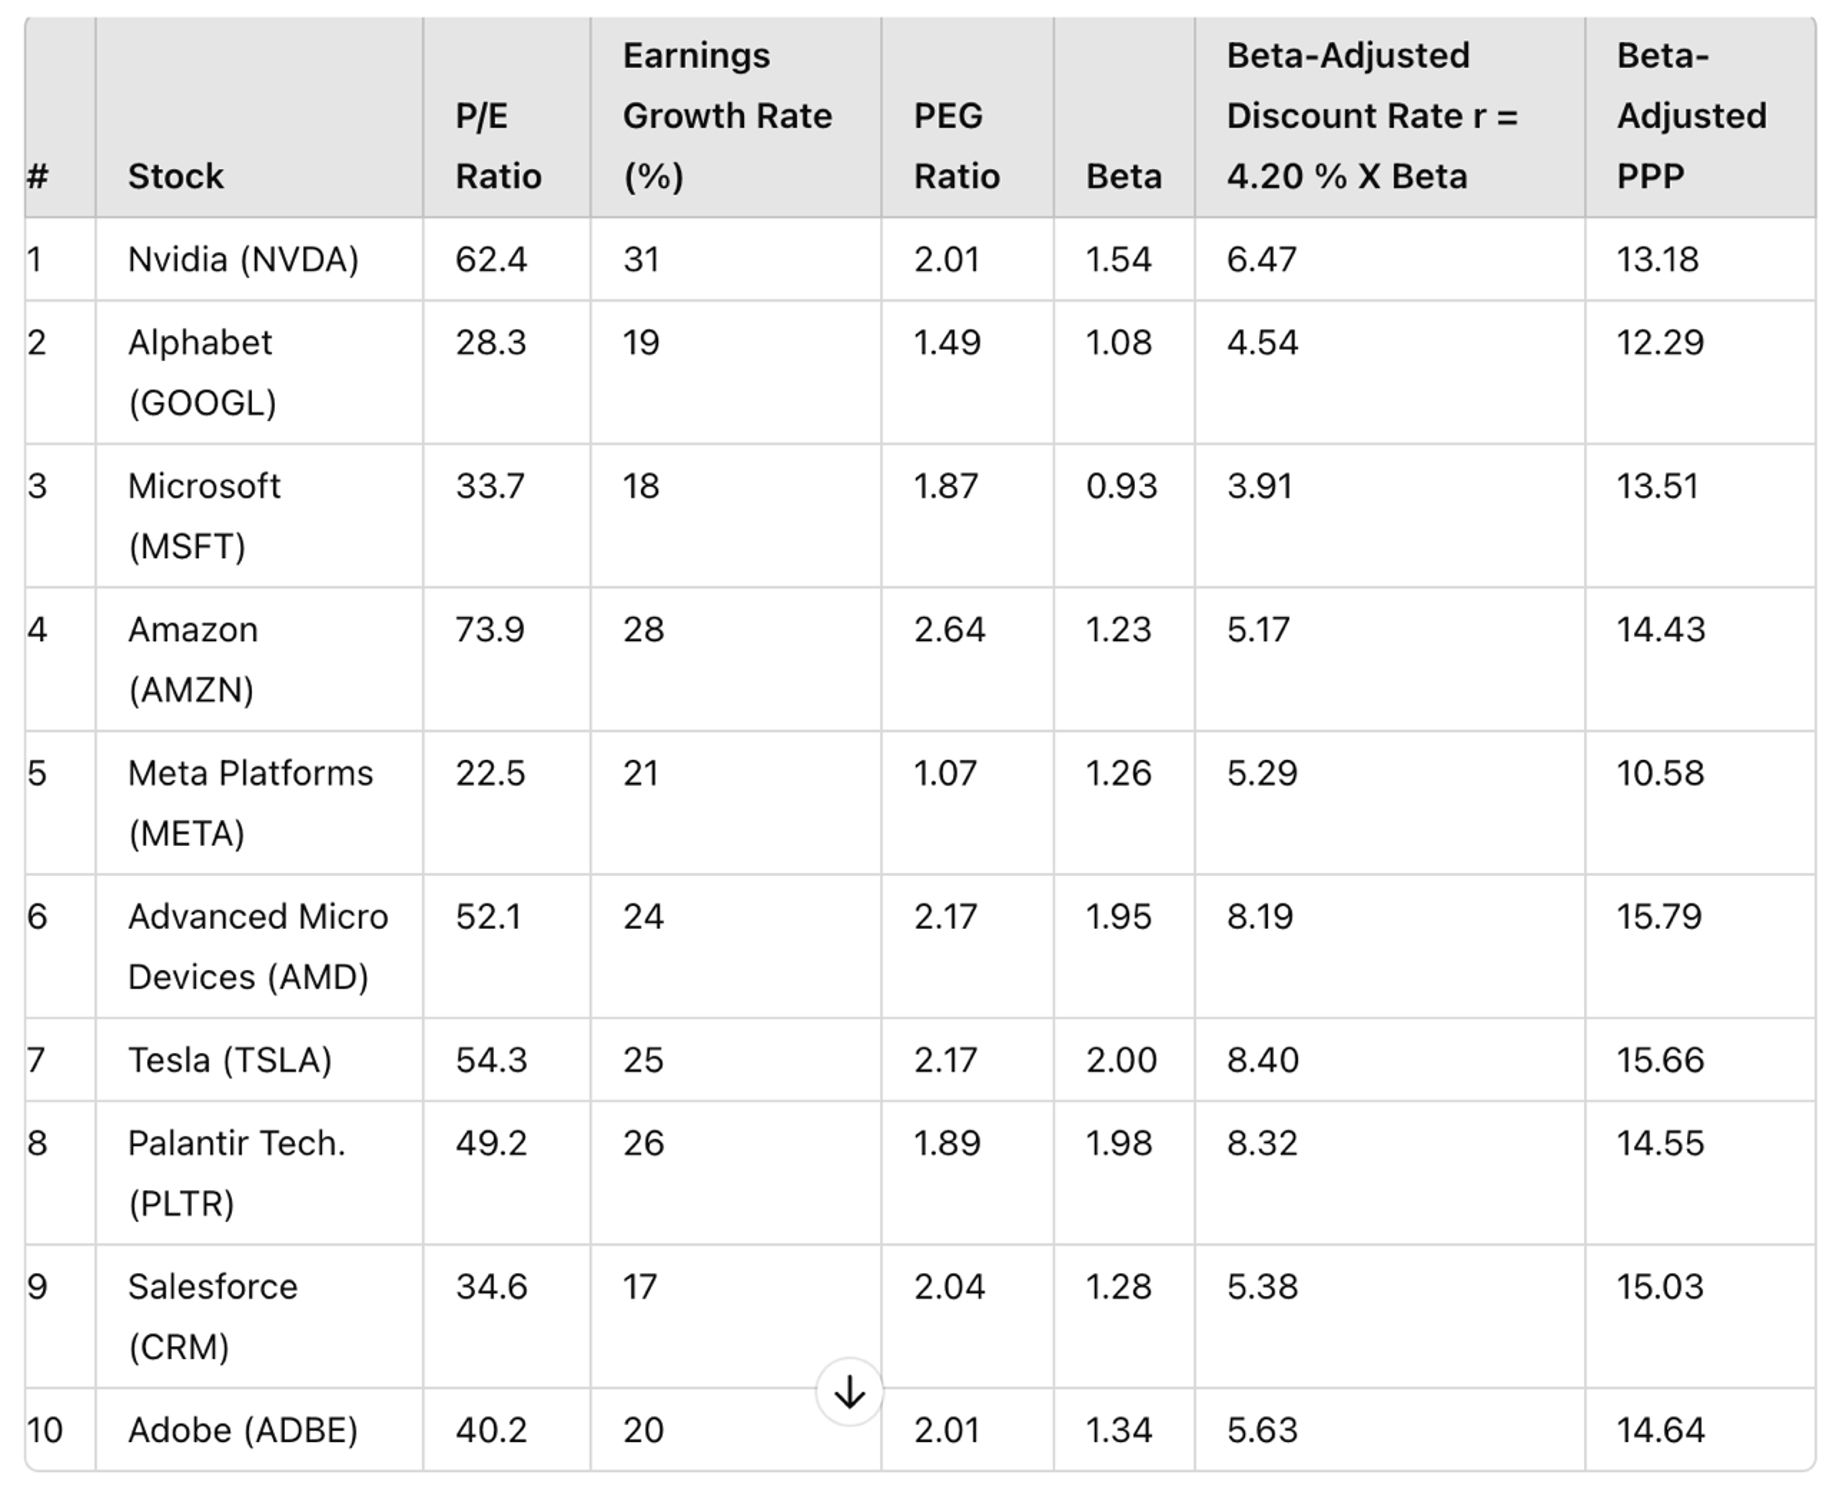 - Most of these stocks appear "overvalued" based on their relatively high and disparate P/E ratios, which do
not take growth into consideration.
- They all seem "overvalued" on the basis of their PEG ratios, which are all over 1.
- Their valuation appears more homogenous and nuanced when using the Beta-Adjusted PPP, with an
overvaluation threshold of 15 corresponding to a stock internal rate of return of 5%.
- It is advisable to continuously update the data in the table and perform simulations for all variables,
especially the projected earnings growth rate, to which the PPP is very sensitive, this feature being a
reflection of the market behavior.
Revolutionary Impact on Stock Evaluation and Investment
The PPP not only provides a more precise evaluation but also revolutionizes stock evaluation by addressing
the limitations of traditional metrics like the P/E ratio and the PEG ratio. While the P/E ratio is static
and does not account for earnings growth, the PEG ratio only offers a rule of thumb adjustment for this
earnings growth. On the other hand, the PPP rigorously incorporates earnings growth in addition to other
crucial variables such as interest rates and stock volatility.
The PPP can transform investment strategies by enabling better risk management, optimized portfolio
allocation, and more accurate evaluations, leading to more stable, long-term returns. It is especially
valuable in today's volatile market environment, where understanding the interplay between growth potential
and risk is crucial.
Conclusion
The PPP is a game-changer in stock evaluation. By integrating key variables into a single, comprehensive
figure, it empowers investors with a nuanced, risk-adjusted measure, enhancing their ability to make
informed, strategic decisions. This metric is poised to become an essential tool for modern financial
analysis, revolutionizing how investors evaluate and manage their portfolios.
For more information on the PPP, please visit www.stockinternalrateofreturn.com
- Most of these stocks appear "overvalued" based on their relatively high and disparate P/E ratios, which do
not take growth into consideration.
- They all seem "overvalued" on the basis of their PEG ratios, which are all over 1.
- Their valuation appears more homogenous and nuanced when using the Beta-Adjusted PPP, with an
overvaluation threshold of 15 corresponding to a stock internal rate of return of 5%.
- It is advisable to continuously update the data in the table and perform simulations for all variables,
especially the projected earnings growth rate, to which the PPP is very sensitive, this feature being a
reflection of the market behavior.
Revolutionary Impact on Stock Evaluation and Investment
The PPP not only provides a more precise evaluation but also revolutionizes stock evaluation by addressing
the limitations of traditional metrics like the P/E ratio and the PEG ratio. While the P/E ratio is static
and does not account for earnings growth, the PEG ratio only offers a rule of thumb adjustment for this
earnings growth. On the other hand, the PPP rigorously incorporates earnings growth in addition to other
crucial variables such as interest rates and stock volatility.
The PPP can transform investment strategies by enabling better risk management, optimized portfolio
allocation, and more accurate evaluations, leading to more stable, long-term returns. It is especially
valuable in today's volatile market environment, where understanding the interplay between growth potential
and risk is crucial.
Conclusion
The PPP is a game-changer in stock evaluation. By integrating key variables into a single, comprehensive
figure, it empowers investors with a nuanced, risk-adjusted measure, enhancing their ability to make
informed, strategic decisions. This metric is poised to become an essential tool for modern financial
analysis, revolutionizing how investors evaluate and manage their portfolios.
For more information on the PPP, please visit www.stockinternalrateofreturn.com
July 13, 2024
EVALUATION OF 10 A.I. STOCKS WITH 3 DIFFERENT METRICS
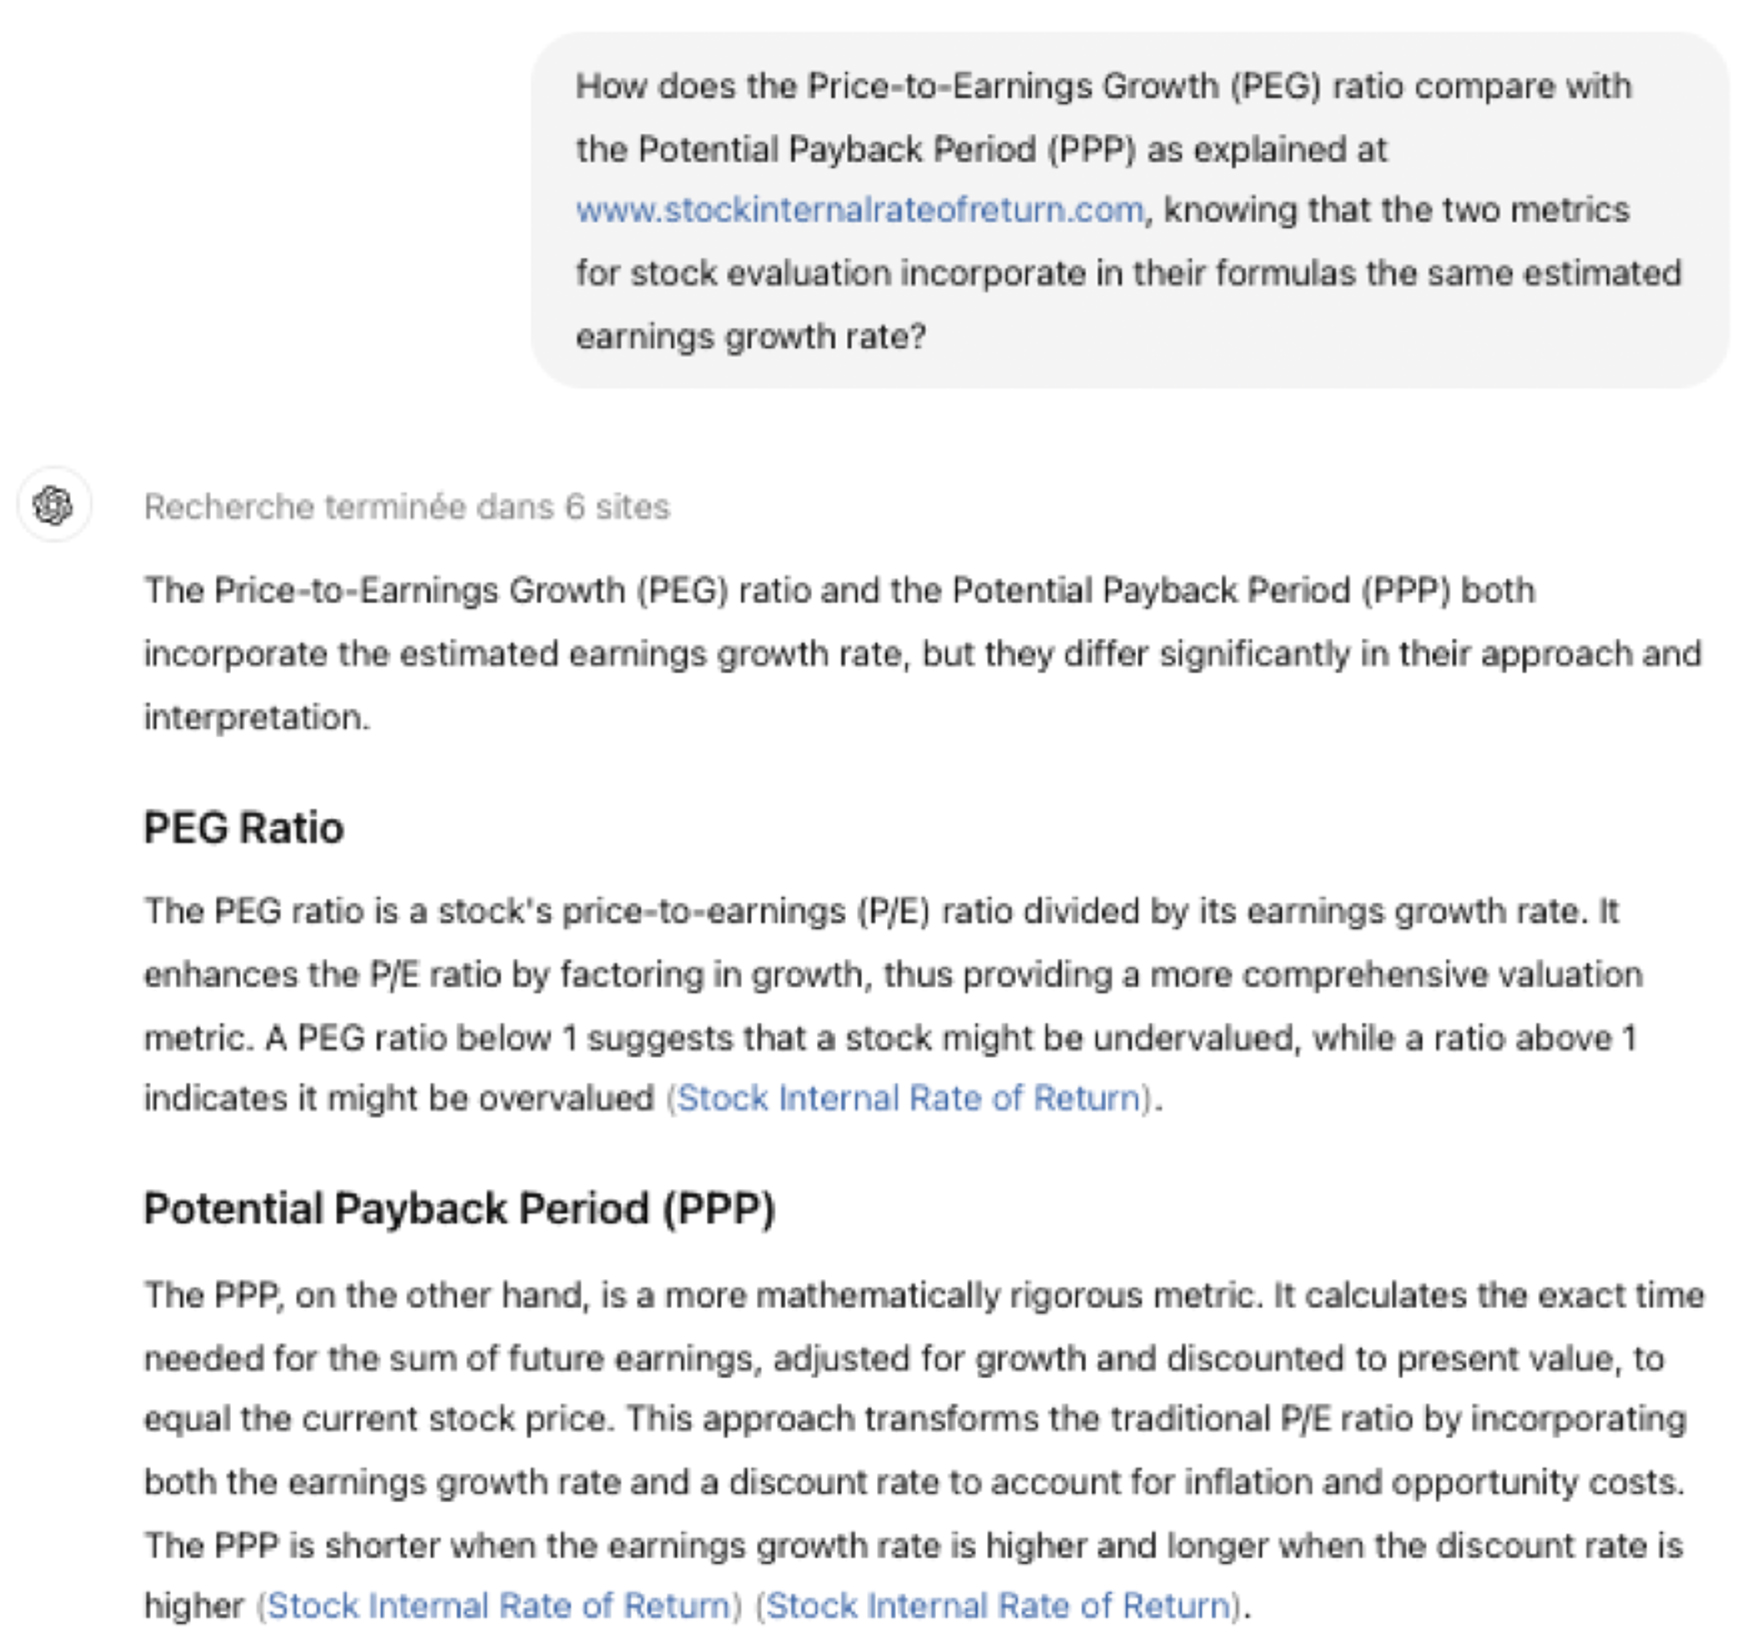
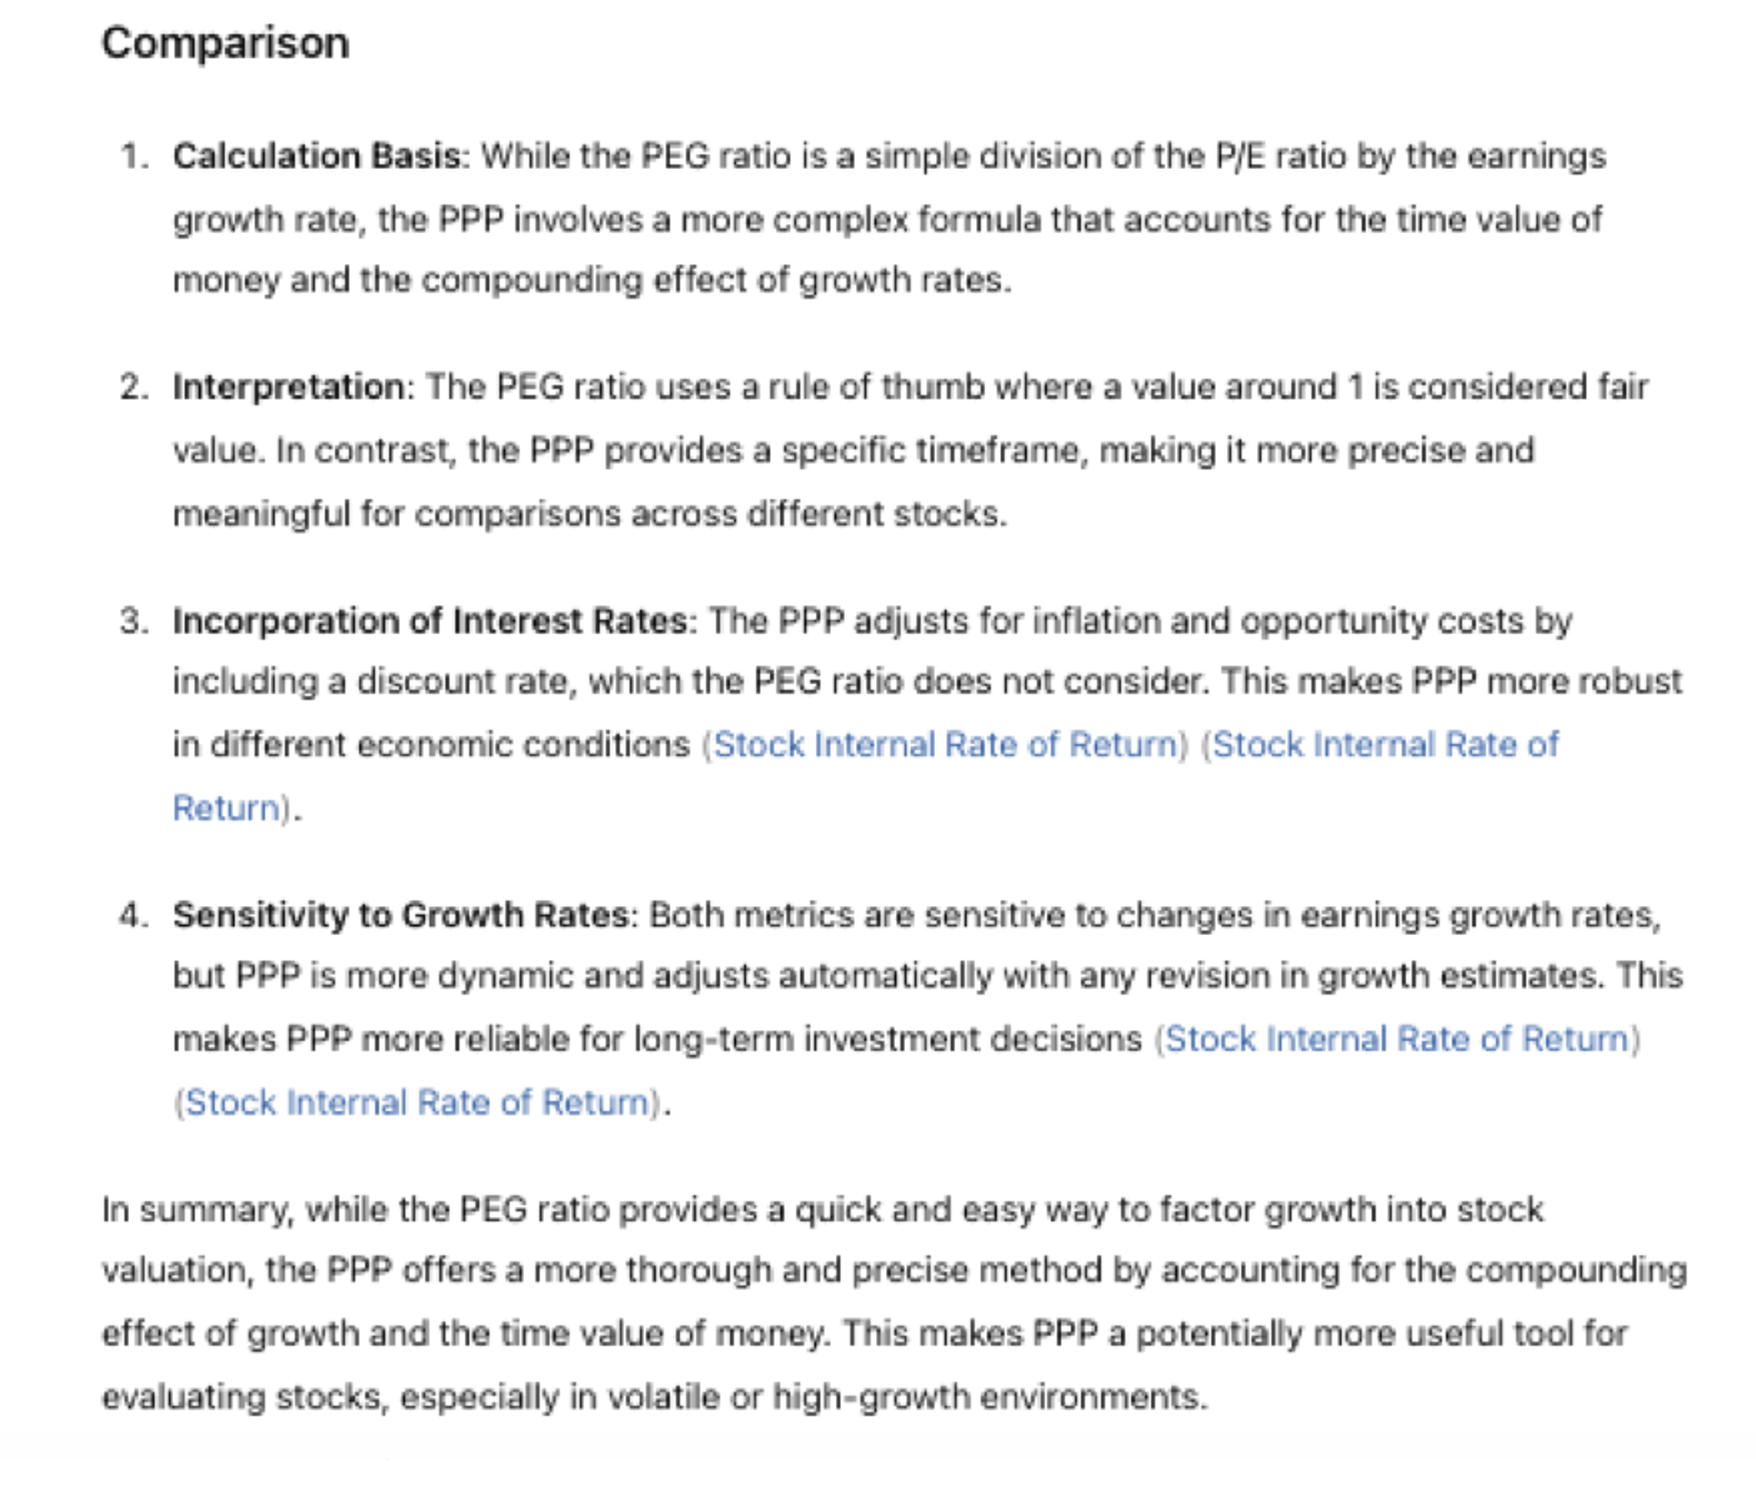
To the question: "In stock evaluation, between the P/E ratio, the PEG ratio and the Potential Payback Period
(PPP) as explained at www.stockinternalrateofreturn.com, which metric seems the
most meaningful, precise and reliable?"
ChatGPT gives this answer: "In evaluating stocks, the Potential Payback Period (PPP) appears to be the most
meaningful, precise, and reliable metric compared to the P/E ratio and the PEG ratio." Read the full
explanation by ChatGPT at https://chatgpt.com/share/294601ab-81da-4689-9bfc-2b3222499186
On a very important point ChatGPT specifies that, compared to the PEG ratio, "the PPP is a superior metric
in terms of rigor and reliability for adjusting the P/E ratio by incorporating the projected earnings growth
rate." https://chatgpt.com/share/30290d3d-b430-44ad-b78c-da88daddaa8e
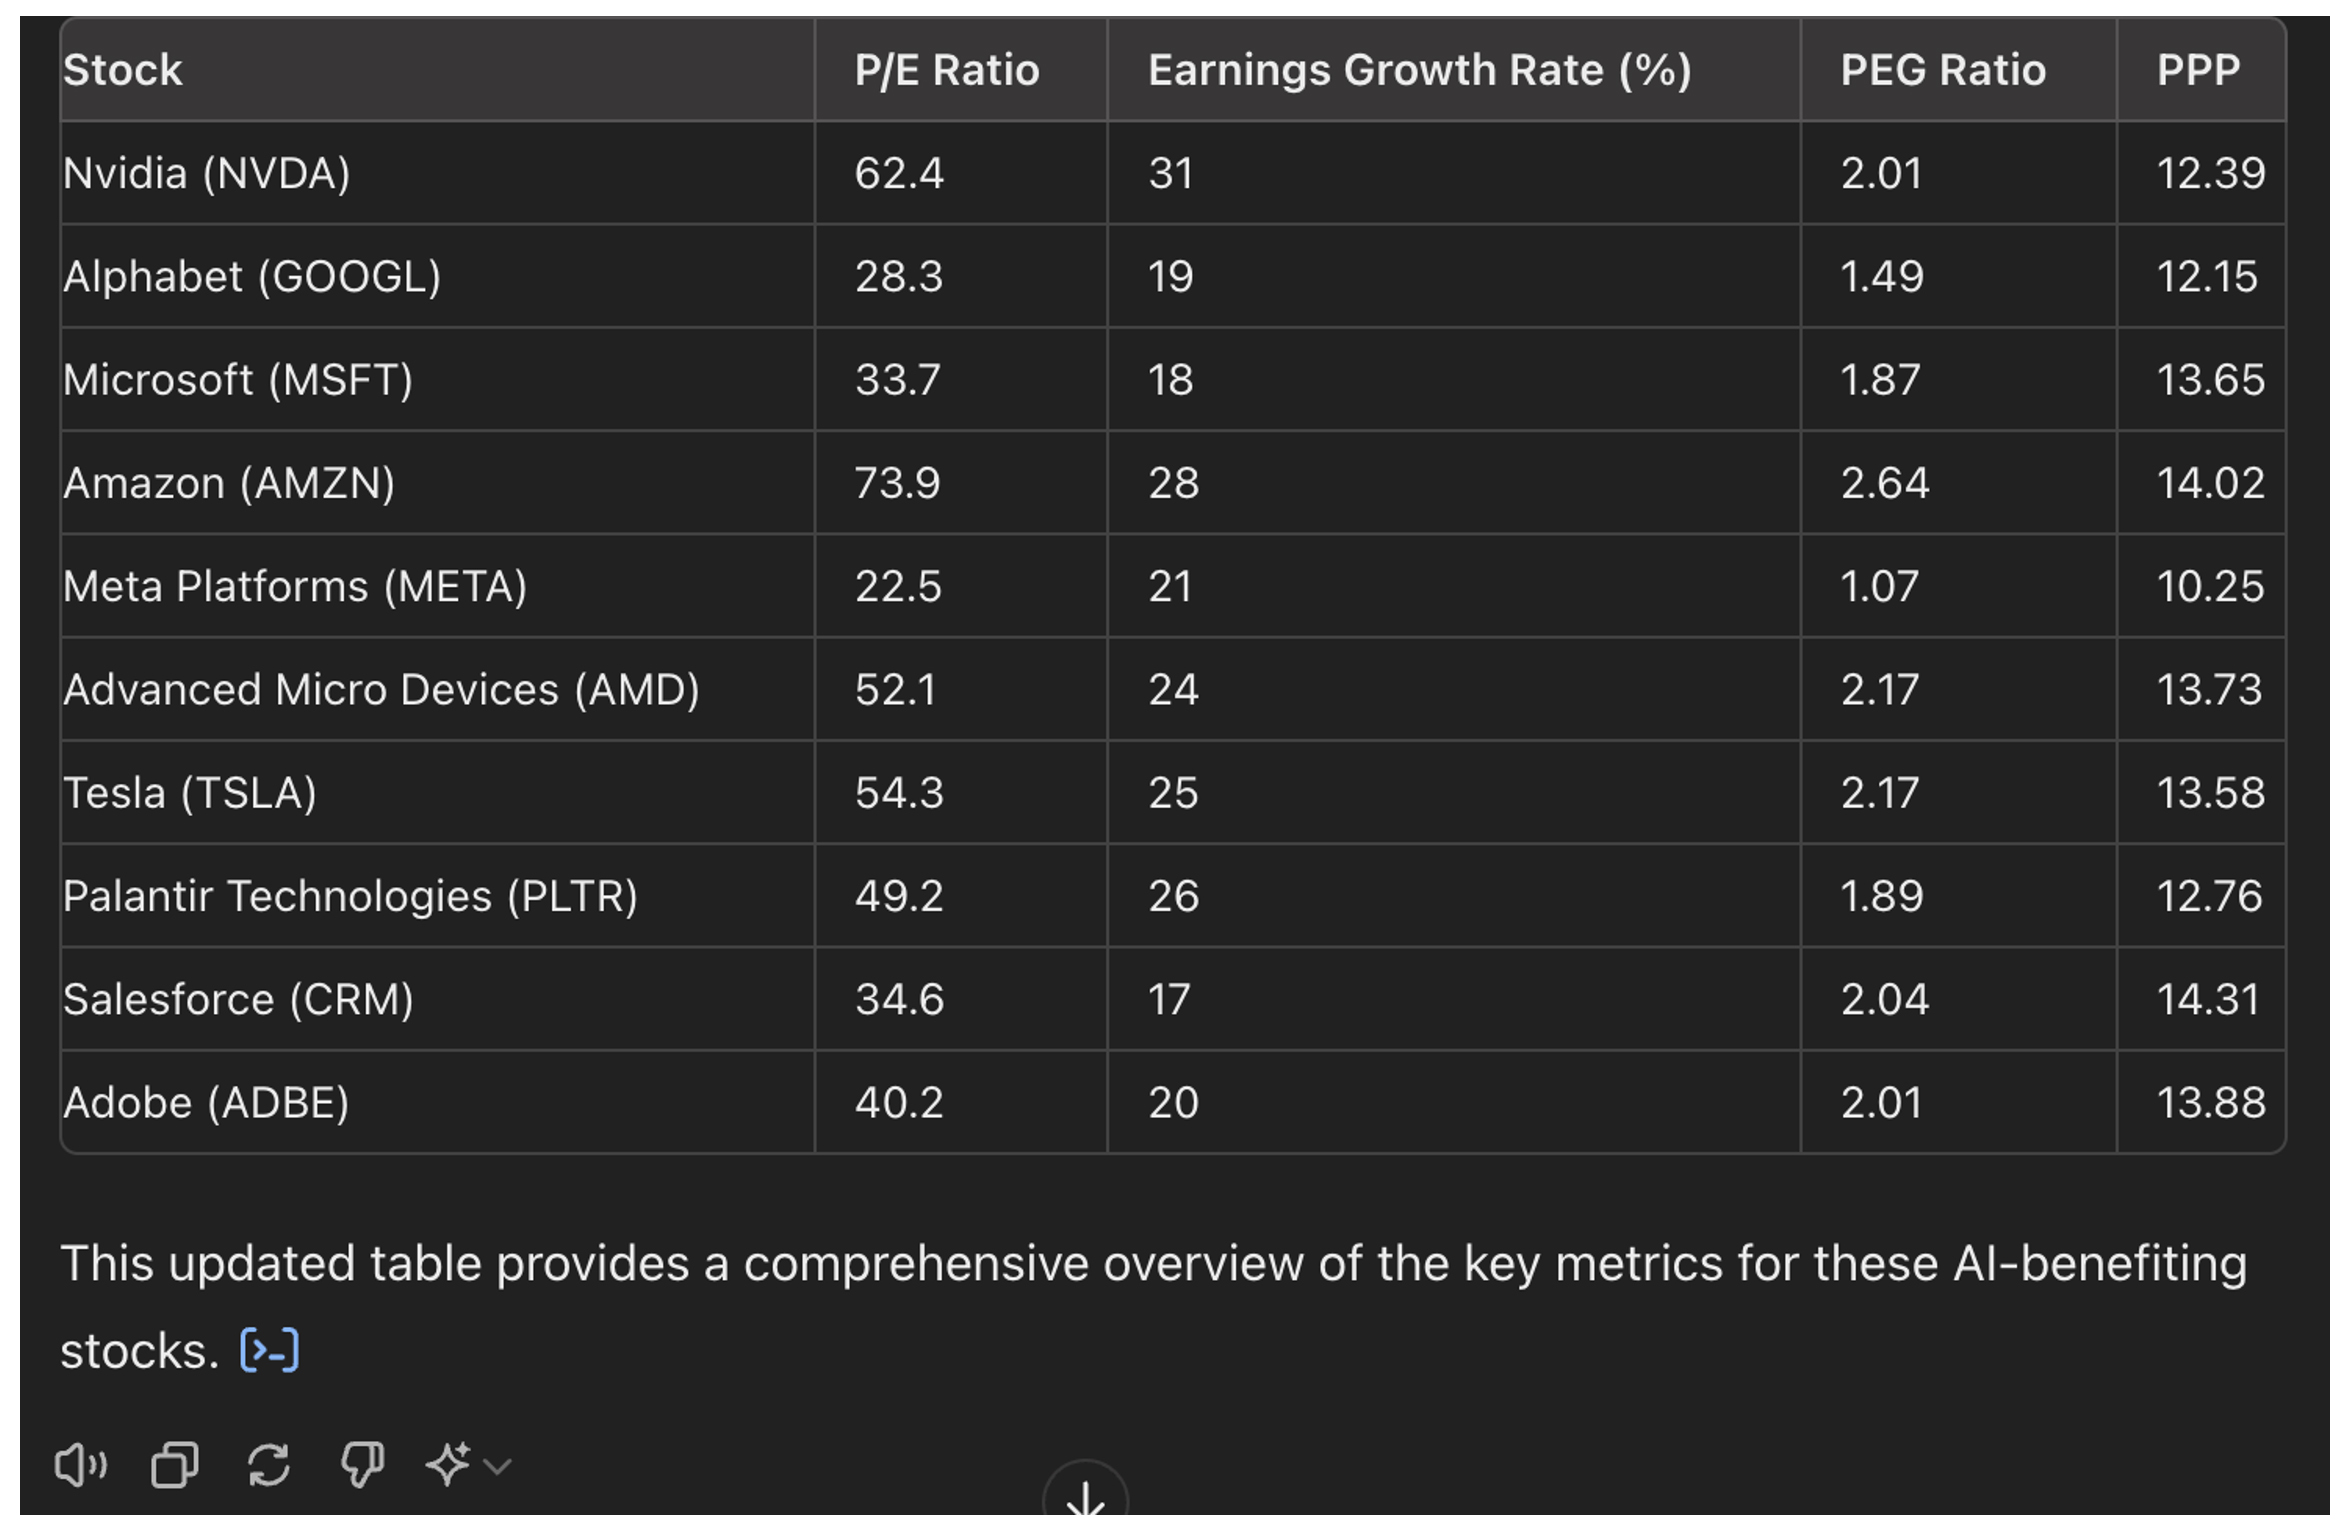
Let’s apply the three available metrics to evaluate and compare the hottest stocks among those being
propelled by the artificial intelligence revolution.
ChatGPT has identified 10 most interesting stocks: Nvidia, Alphabet, Microsoft, Amazon, Meta Platforms,
Advanced Micro Devices (AMD), Tesla, Palantir Technologies, Salesforce, Adobe.
https://chatgpt.com/share/cecf8c8d-40ba-47da-b2b4-7bb60e996f3a
All sorts of simulations for all variables can be performed instantly at
https://stockinternalrateofreturn.com/instant_calculations.html
In the above table, interest rate r = 4.20% for all stocks.
STOCK SELECTION
Based on the P/E Ratio
1- Meta Platforms (22.5)
2- Alphabet (28.3)
3- Microsoft (33.7)
As of July 2024, the average P/E ratio of the NASDAQ is around 33.
Based on the PEG Ratio
1- Meta Platforms (1.07)
2- Alphabet (1.49)
3- Microsoft (1.87)
The 10 stocks in the table are all "overvalued" with all PEG Ratios above one (PEG > 1).
The above three stocks are the less "overvalued".
Based on the PPP
1- Meta Platforms (10.25)
2- Alphabet (12.15)
3- Nvidia (12.39)
When the long-term risk-free interest rate is at 4.20%, the PPP should not exceed 16 years, corresponding to
a stock internal rate of return of also 4.20%, without taking into account any risk premium.
According to ChatGPT, "The evolution from the P/E ratio to the PEG ratio
and finally to the Potential Payback Period (PPP) reflects an increasing sophistication in stock
valuation methods, each incorporating additional financial metrics to provide a more comprehensive
assessment."
https://chatgpt.com/share/b0e75570-53b1-4c28-ae90-513a37c436da
Rainsy Sam
July 11, 2024
EMPLOYING ARTIFICIAL INTELLIGENCE TO ENHANCE STOCK EVALUATION
According to ChatGPT there is a recent progress in the field of stock evaluation leading to a new metric
more reliable than the traditional P/E ratio.
- First quote from ChatGPT: "The Potential Payback Period (PPP) developed by Rainsy Sam does represent a
notable advancement in the field of stock evaluation. The PPP is a mathematical adjustment of the
traditional Price Earnings (P/E) ratio to account for earnings growth rates and discount rates, providing a
more comprehensive and dynamic measure of a stock's value."
See entire text at https://chatgpt.com/share/efbf0ce3-3ec6-4595-9516-6dc838464416
- Second quote from ChatGPT: "While the P/E ratio provides a simple and quick assessment, the PPP offers a
more detailed and realistic evaluation by incorporating growth and discount rates, making it a more reliable
tool for investors looking to understand the true value and potential of their investments."
See entire text at https://chatgpt.com/share/0394d2b2-419d-4133-af6e-ce4e1f8969b6
July 08, 2024
STOCK EVALUATION :
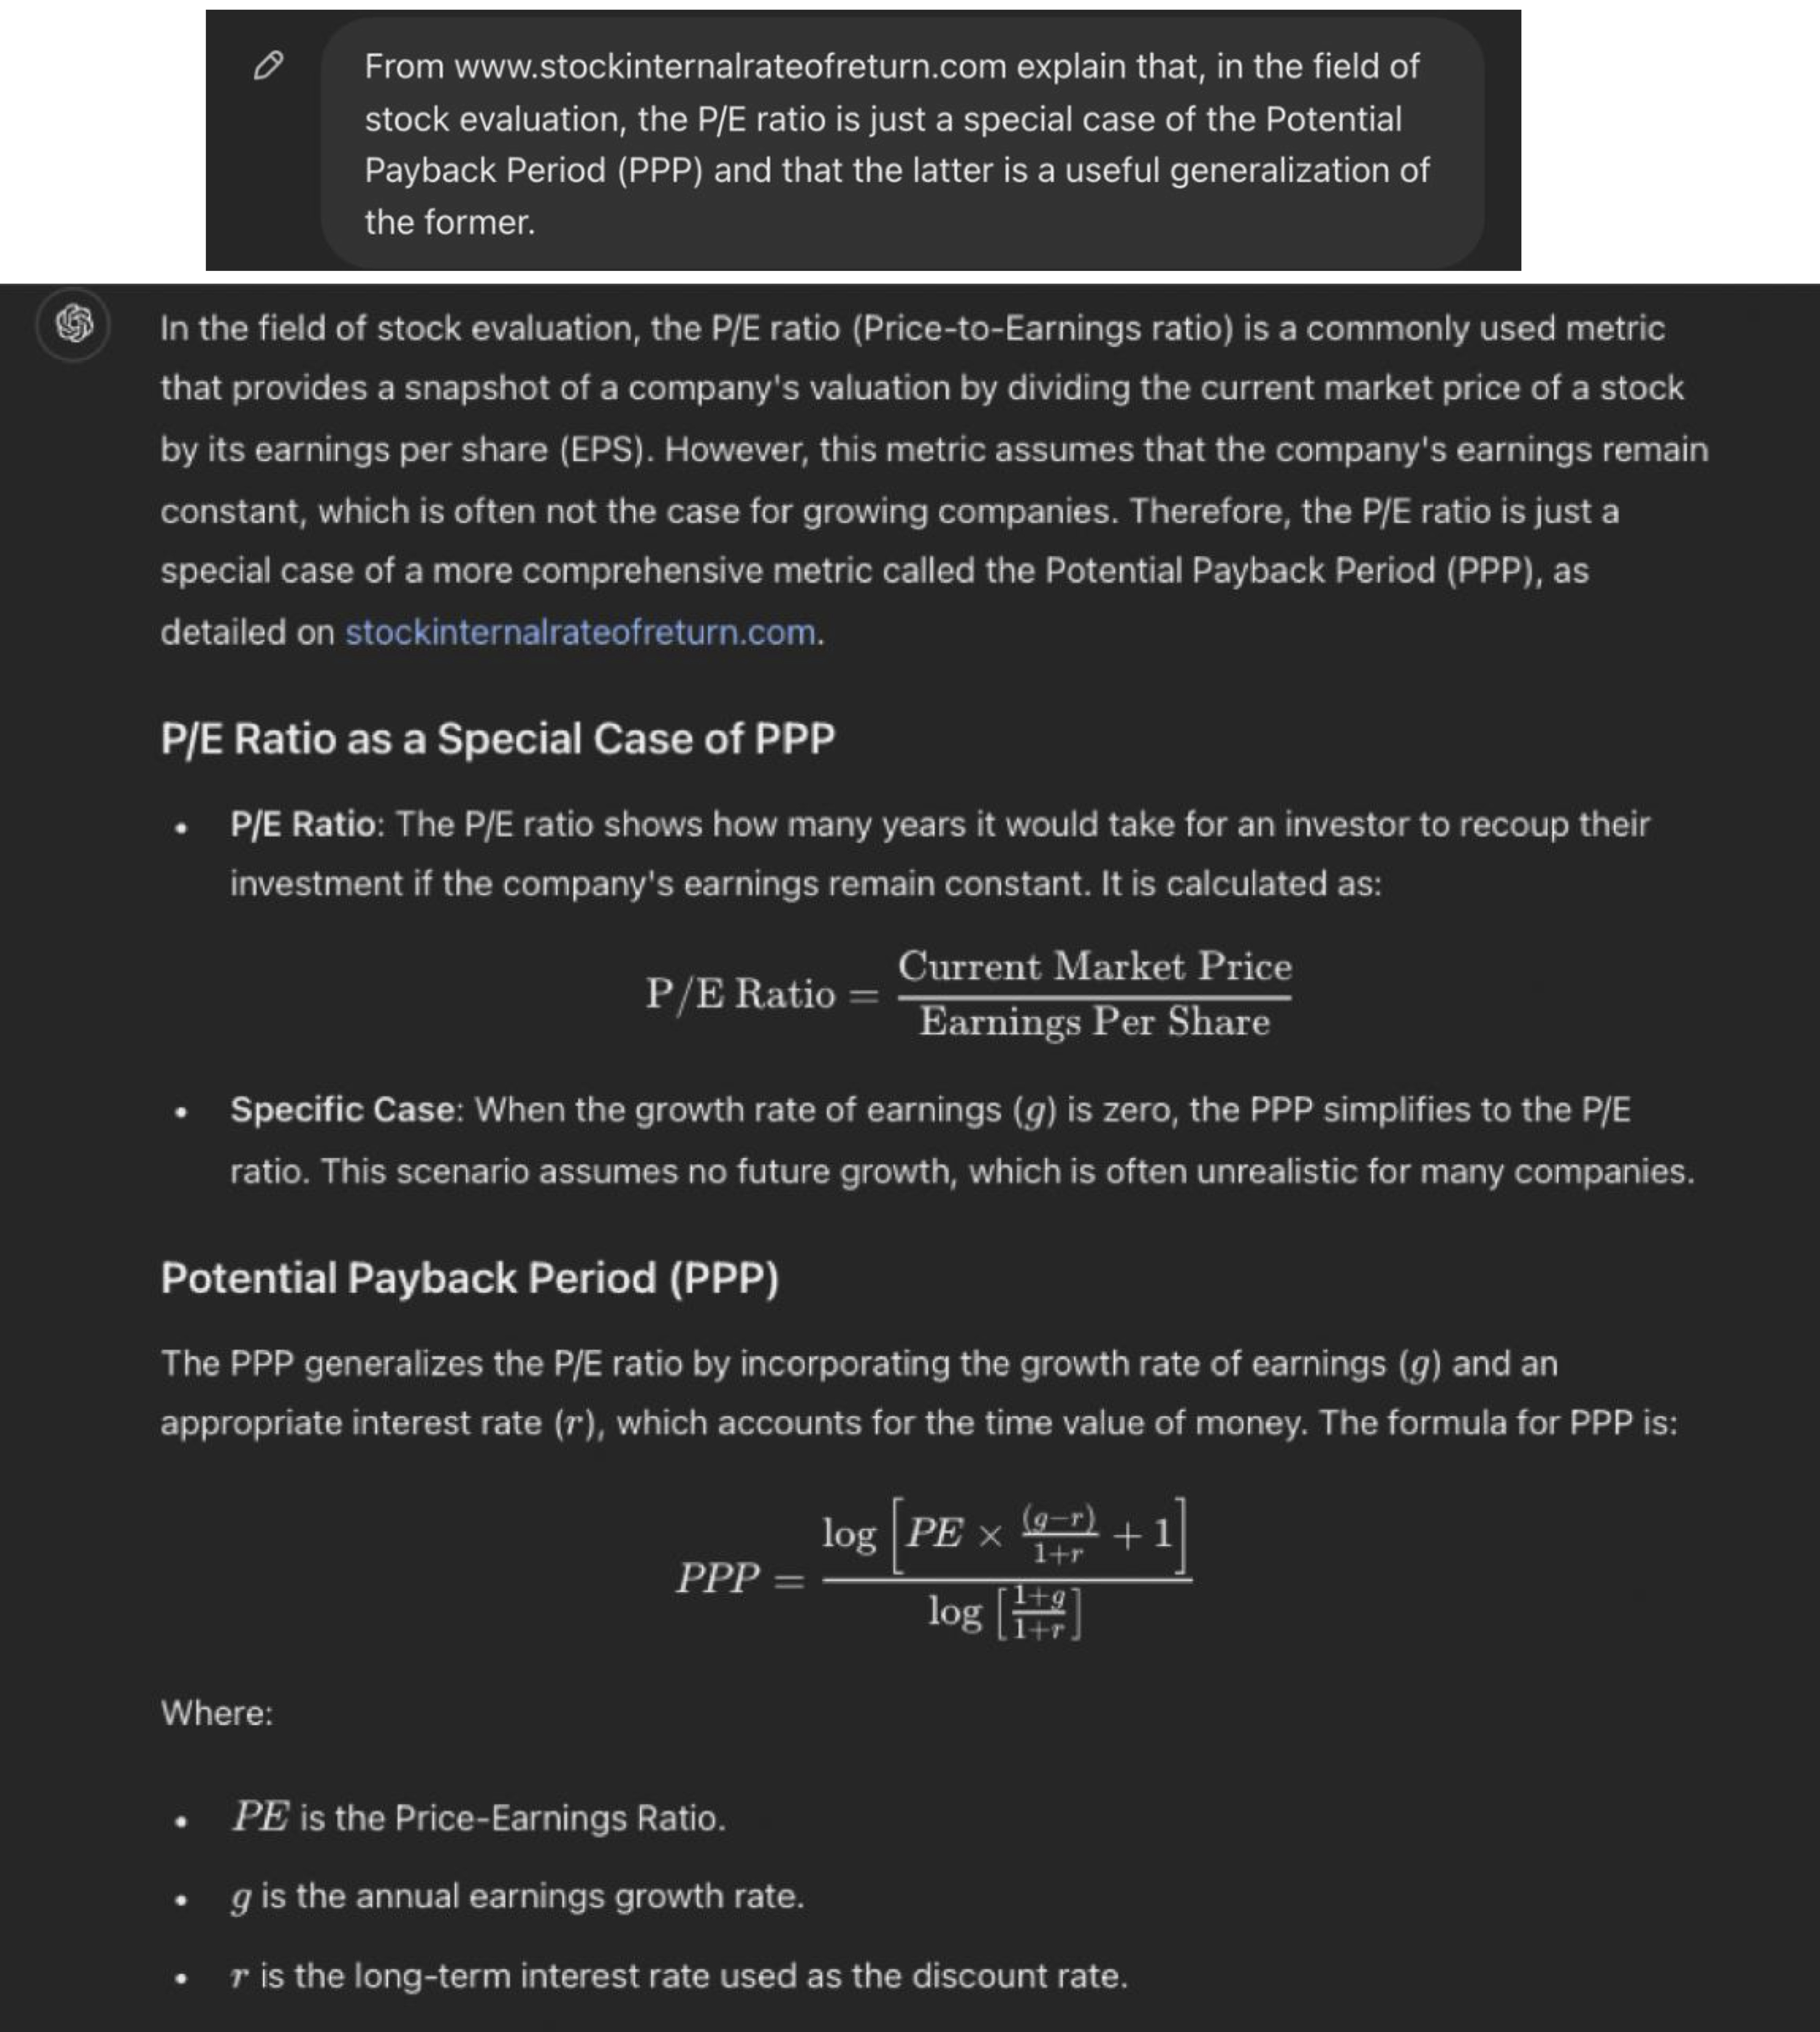
THE P/E RATIO IS JUST A SPECIAL CASE OF THE POTENTIAL PAYBACK PERIOD (PPP)
AN ANALYSIS BY CHATGTP USING ARTIFICIAL INTELLIGENCE
July 08, 2024
THE POTENTIAL PAYBACK PERIOD (PPP) IS A “SUPERIOR TOOL FOR STOCK EVALUATION”
ACCORDING TO ARTIFICIAL INTELLIGENCE THROUGH CHATGPT
July 07, 2024
EVALUATION OF ADVANCED MICRO DEVICES (AMD) AND MICRON TECHNOLOGY (MU),
TWO INTERESTING STOCKS FOR WHICH THE TRADITIONAL P/E RATIO IS NOT APPLICABLE
Advanced Micro Devices (AMD) and Micron
Technology (MU) are two interesting US semiconductor companies
involved in the Artificial Intelligence (AI) revolution. But they cannot be evaluated with the traditional
P/E ratio because they are incurring temporary losses or their earnings are currently negligible, being in a
turnaround situation.
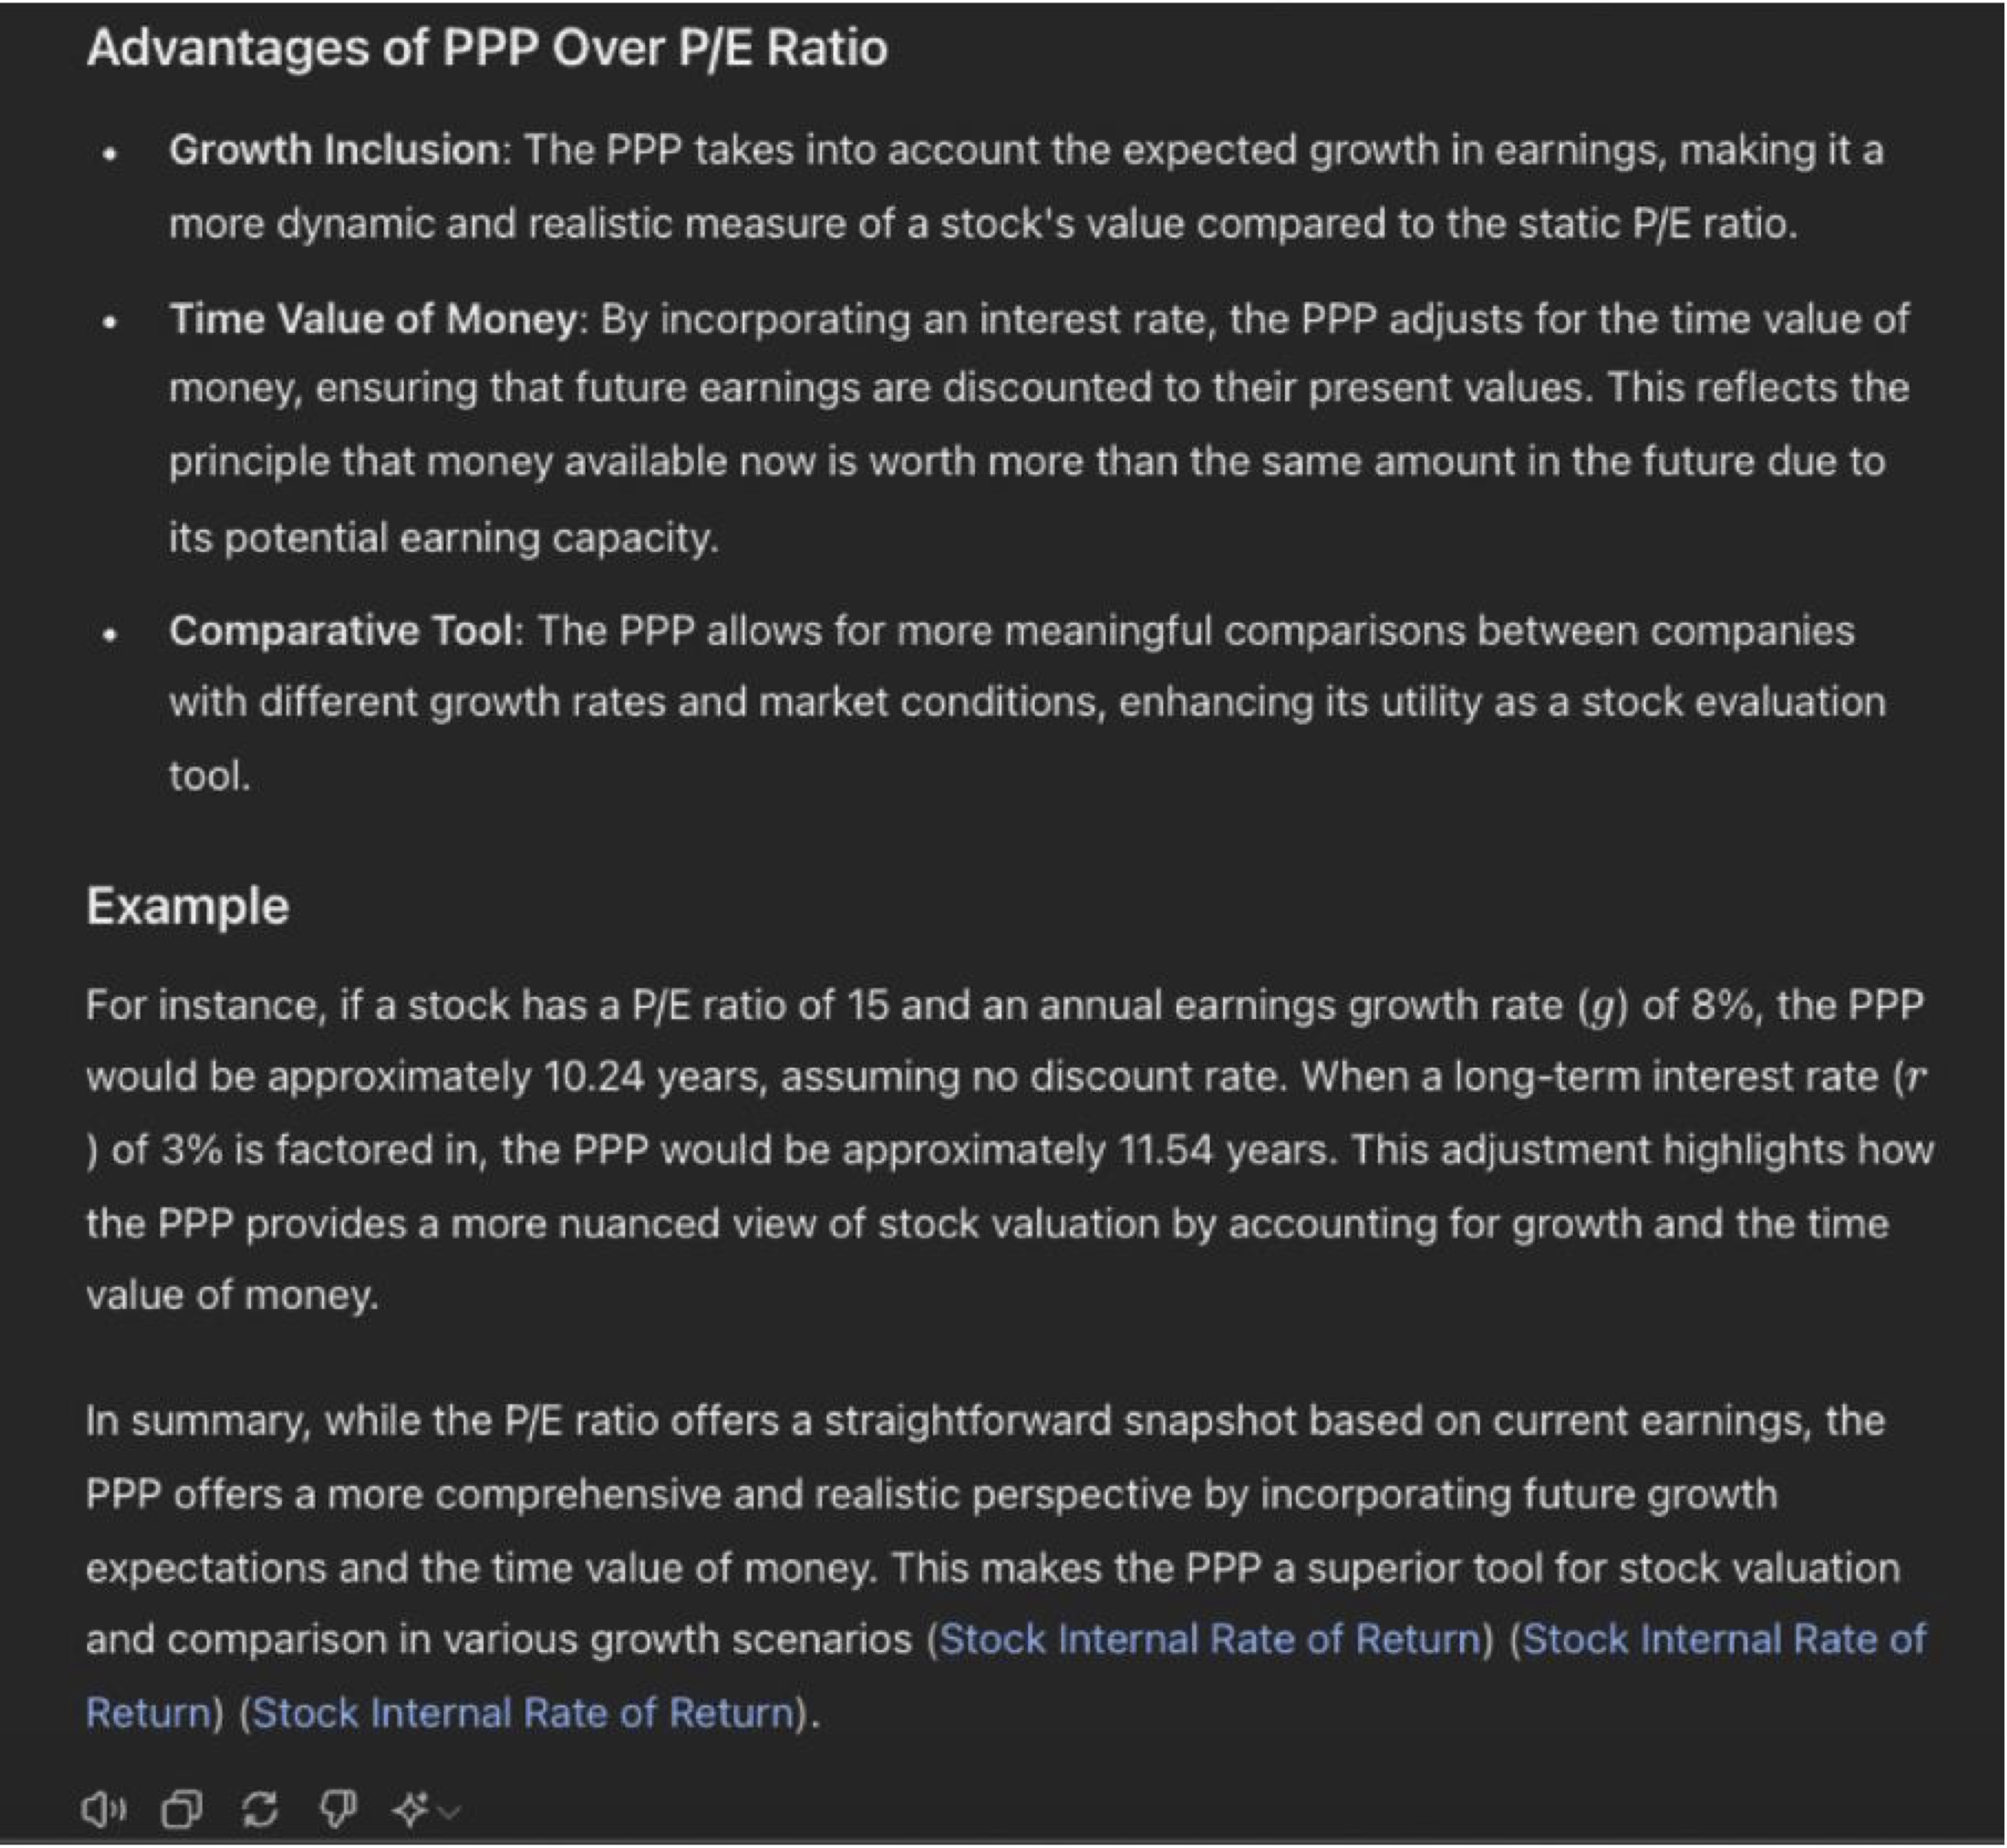
The Potential Payback Period (PPP) is as an alternative stock evaluation metric when the traditional P/E
ratio is inapplicable such as in the cases of start-ups, temporarily loss-making companies or those in
turnaround situations.
Unlike the traditional P/E Ratio, which is a most simple tool that evaluates a stock based on the earnings
of a single year, the PPP does so on the basis of earnings generated over a much longer period, in fact,
over as many years as it takes to equalize those future earnings with the current share price. By doing so,
the PPP is a more comprehensive, forward-looking and stable evaluation tool that can be used to meaningfully
compare stocks in all situations.
 Here are the examples of two companies with non-significant P/E ratios as of July 05, 2024 :
- Advanced Micro Devices (AMD) with a P/E ratio (TTM) of 171.90 / 0.691 = 248.77
- Micron Technology (MU) with a P/E ratio (TTM) of 131.60 / – 1.41 = – 93.33
Here are the examples of two companies with non-significant P/E ratios as of July 05, 2024 :
- Advanced Micro Devices (AMD) with a P/E ratio (TTM) of 171.90 / 0.691 = 248.77
- Micron Technology (MU) with a P/E ratio (TTM) of 131.60 / – 1.41 = – 93.33
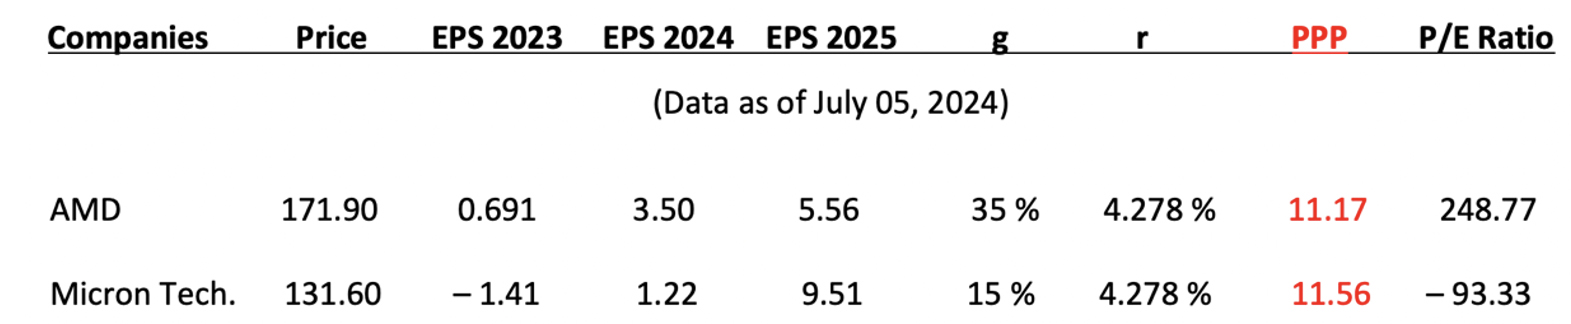 Applying the above formula for special cases where earnings per share (EPS) are negative or close to zero in
the first years, we can see that the PPPs of Advanced Micro Devices (AMD) and Micron Technology (MU) –
respectively 11.17 and 11.56 – are comparable to those of other companies in the same industry, whereas no
significant comparisons can be made on the basis of their P/E ratios.
Applying the above formula for special cases where earnings per share (EPS) are negative or close to zero in
the first years, we can see that the PPPs of Advanced Micro Devices (AMD) and Micron Technology (MU) –
respectively 11.17 and 11.56 – are comparable to those of other companies in the same industry, whereas no
significant comparisons can be made on the basis of their P/E ratios.
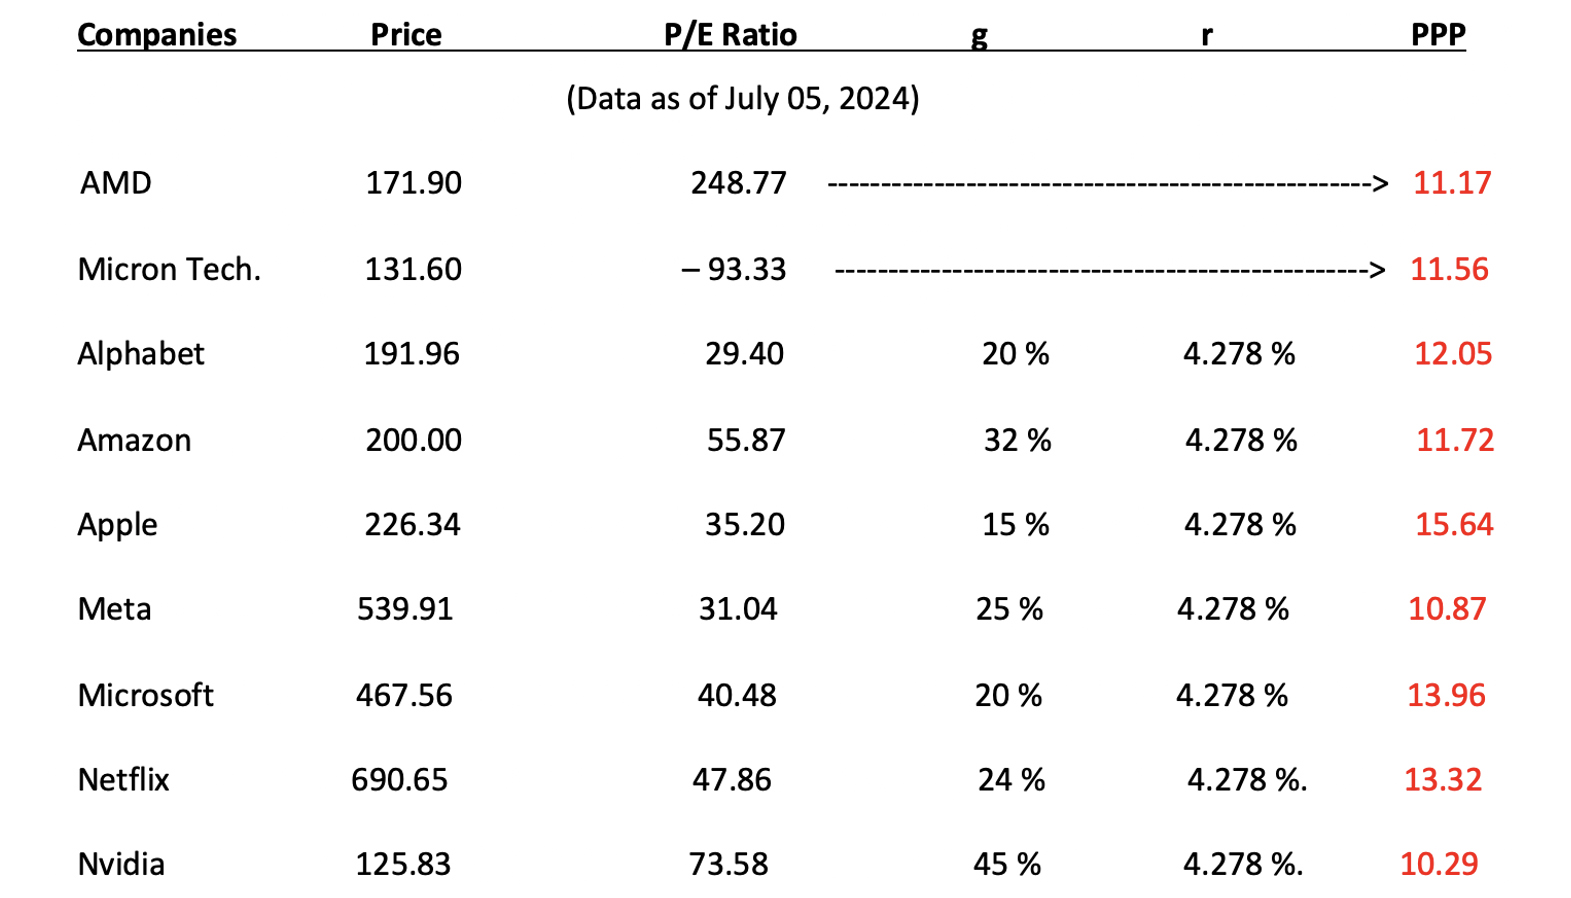 The PPPs of the seven other stocks in the above table are calculated by applying the basic PPP formula when
EPS > 0 :
The PPPs of the seven other stocks in the above table are calculated by applying the basic PPP formula when
EPS > 0 :
 Instant calculations can be performed at https://www.stockinternalrateofreturn.com/instant_calculations.html
In practice, the P/E ratio can take any value (up to infinity) or become meaninglessly negative, whereas the
PPP varies within a relatively narrow range of approximately 10–15 (years). These figures are significant,
realistic, and credible because of their reasonable order of magnitude and relative stability, demonstrating
the homogeneity and rationality of the financial market. The financial market confirms its rationality when
we use appropriate metrics.
The above table shows that Nvidia and Meta are the most attractive stocks of the list, with no
other stock
showing a PPP below 11 (years).
Further remark
Through various simulations we can see that the PPP is highly sensitive to any change in the earnings growth
rate "g".
The reflects the fact that the stock market is highly sensitive to changes in expected earnings growth
rates.
This explains why stock prices can be very sensitive to quarterly earnings revisions, which – through
extrapolations – can result in revisions in earnings growth rates over a period well beyond the quarters in
question.
Any new earnings growth rate "g" immediately and automatically modifies the PPP level, resulting in stock
price adjustments.
In any case, we must remember that the reliability and precision of any evaluation model, regardless of how
relevant it may be, depend on the reliability and precision of the data. For the PPP, the most sensitive
data is "g", the estimated earnings growth rate for the next two to three years (tacitly and temporarily
extrapolated beyond), which has to be updated according to the most relevant and recent information.
Rainsy Sam
Instant calculations can be performed at https://www.stockinternalrateofreturn.com/instant_calculations.html
In practice, the P/E ratio can take any value (up to infinity) or become meaninglessly negative, whereas the
PPP varies within a relatively narrow range of approximately 10–15 (years). These figures are significant,
realistic, and credible because of their reasonable order of magnitude and relative stability, demonstrating
the homogeneity and rationality of the financial market. The financial market confirms its rationality when
we use appropriate metrics.
The above table shows that Nvidia and Meta are the most attractive stocks of the list, with no
other stock
showing a PPP below 11 (years).
Further remark
Through various simulations we can see that the PPP is highly sensitive to any change in the earnings growth
rate "g".
The reflects the fact that the stock market is highly sensitive to changes in expected earnings growth
rates.
This explains why stock prices can be very sensitive to quarterly earnings revisions, which – through
extrapolations – can result in revisions in earnings growth rates over a period well beyond the quarters in
question.
Any new earnings growth rate "g" immediately and automatically modifies the PPP level, resulting in stock
price adjustments.
In any case, we must remember that the reliability and precision of any evaluation model, regardless of how
relevant it may be, depend on the reliability and precision of the data. For the PPP, the most sensitive
data is "g", the estimated earnings growth rate for the next two to three years (tacitly and temporarily
extrapolated beyond), which has to be updated according to the most relevant and recent information.
Rainsy Sam
June 27, 2024
ARTIFICIAL INTELLIGENCE (A.I.) HIGHLIGHTS THE MERITS AND
INNOVATIVE NATURE OF THE POTENTIAL PAYBACK PERIOD (PPP)
AS A TOOL FOR STOCK VALUATION
I – Definition of the Potential Payback Period (PPP)
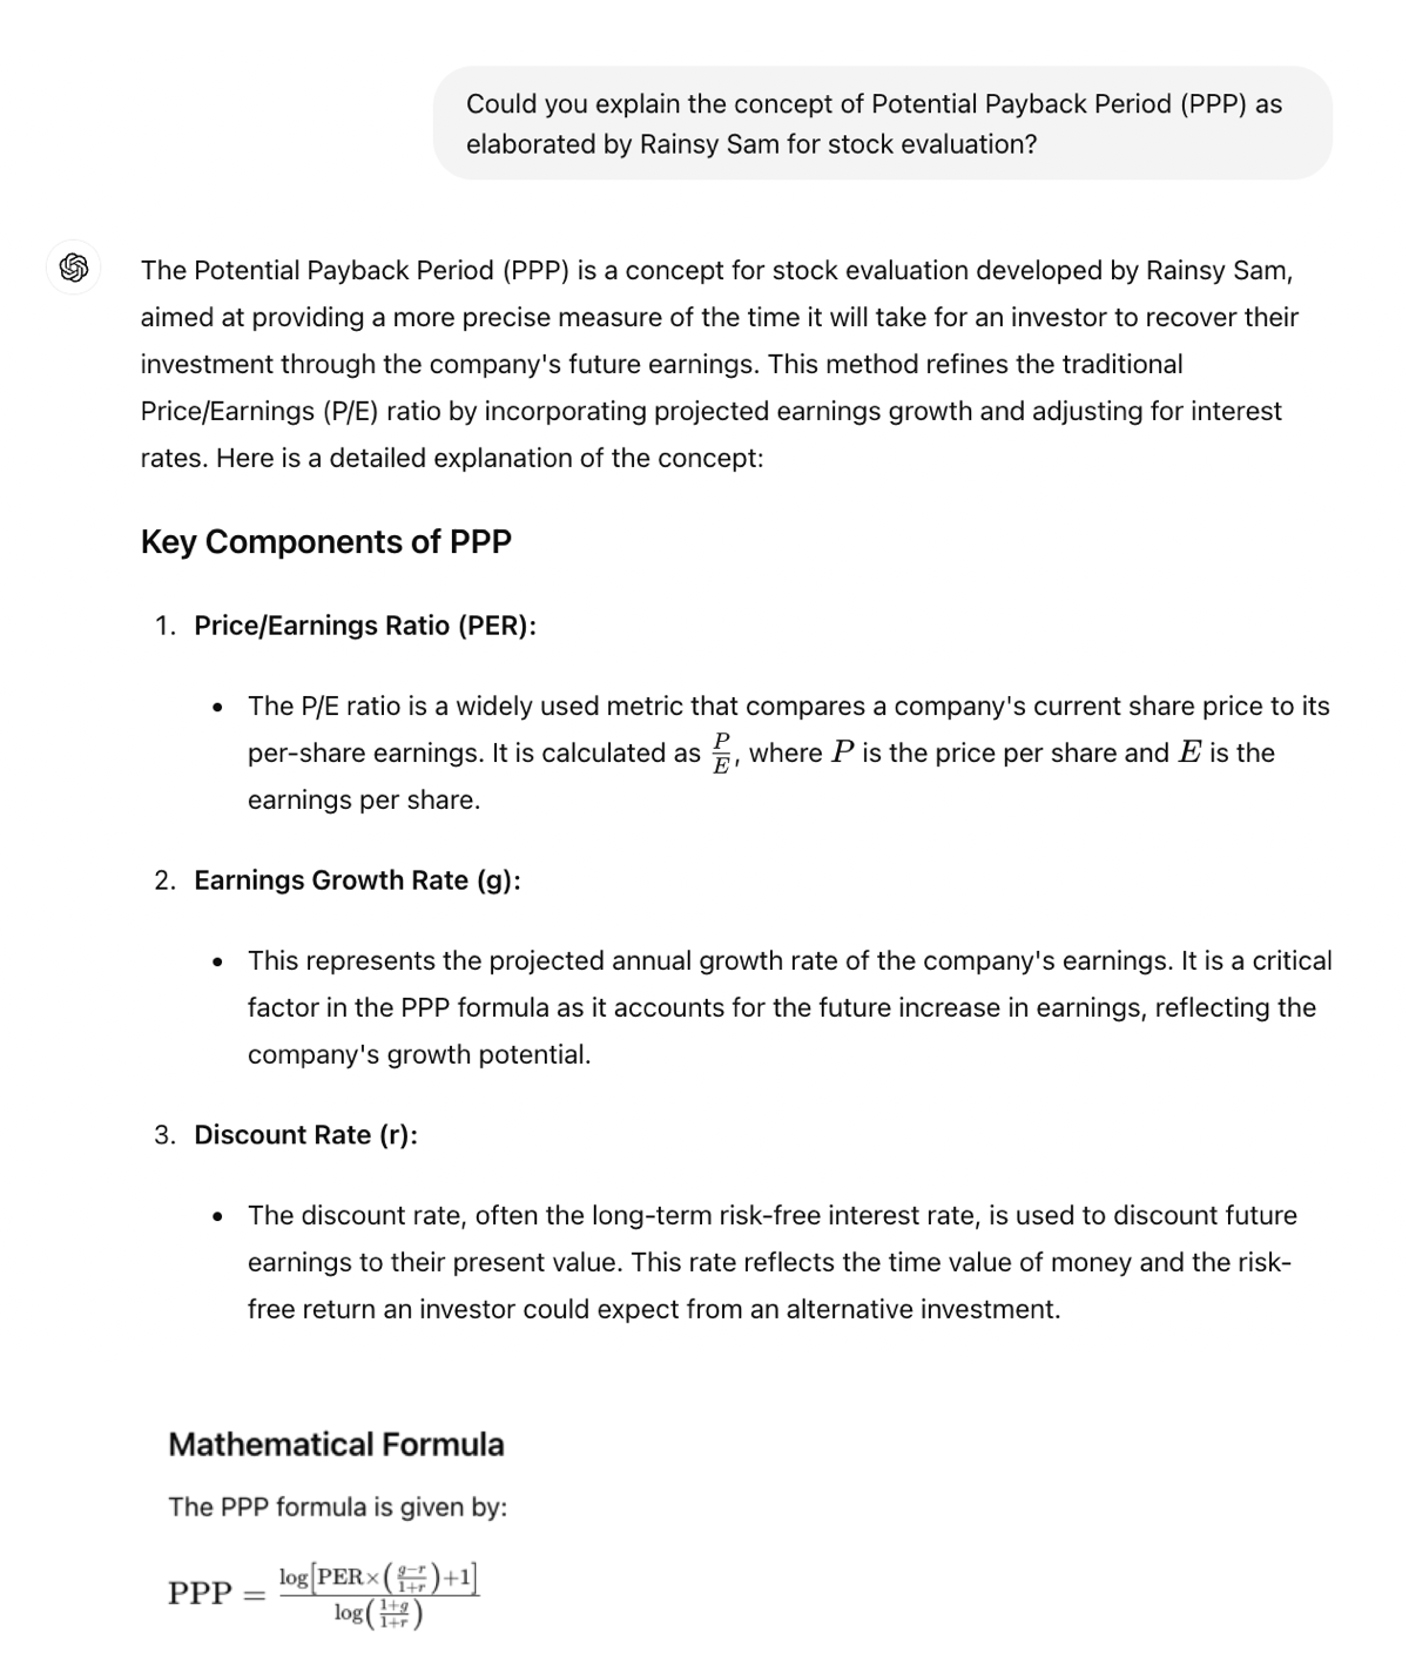
According to A.I.-based ChatGPT, "The Potential Payback Period (PPP) is a
concept for stock evaluation developed by Rainsy Sam. It is defined as the amount of time required to
equalize the current stock price with the sum of future earnings per share. It is a sophisticated tool that
refines the traditional Price/Earnings (P/E) ratio by incorporating projected earnings growth and adjusting
for interest rates. This makes the PPP a more dynamic and informative measure compared to the static P/E
ratio (…).
The PPP can be particularly useful in environments where the P/E ratio might be misleading due to high
growth rates or varying interest rates."
II – Evolution of metrics for stock evaluation
According to A.I.-based ChatGPT, "The evolution from the Price-to-Earnings
(P/E) Ratio to the Price/Earnings to Growth (PEG) Ratio, and finally to the Potential Payback Period (PPP)
reflects a shift towards more comprehensive and precise stock valuation metrics.
- The Price-to-Earnings (P/E) Ratio is straightforward and widely used, but its primary limitation is that
it does not account for the company's growth prospects. Therefore, a high P/E ratio could either indicate an
overvalued stock or a company with high future growth expectations, which can be ambiguous without further
context.
- To address the P/E ratio's limitations, the Price/Earnings to Growth (PEG) Ratio incorporates the earnings
growth rate into the evaluation, but it does so by just dividing the P/E ratio by the annual earnings growth
rate.
- The Potential Payback Period (PPP) advances this concept further by offering a more rigorous and
mathematically precise method of incorporating growth rates and discount rates into stock valuation. This
metric refines the P/E ratio by including both the growth rate (g) and a discount rate (r), which accounts
for inflation and the opportunity cost of investing in the stock.
In conclusion, the PPP represents a significant evolution in stock
valuation metrics by addressing the limitations of both the P/E and PEG ratios. It offers a more
comprehensive and precise approach, allowing for more meaningful comparisons and better investment
decisions. This progression from P/E to PEG to PPP demonstrates a trend towards integrating more
variables to enhance the accuracy and reliability of stock evaluations."
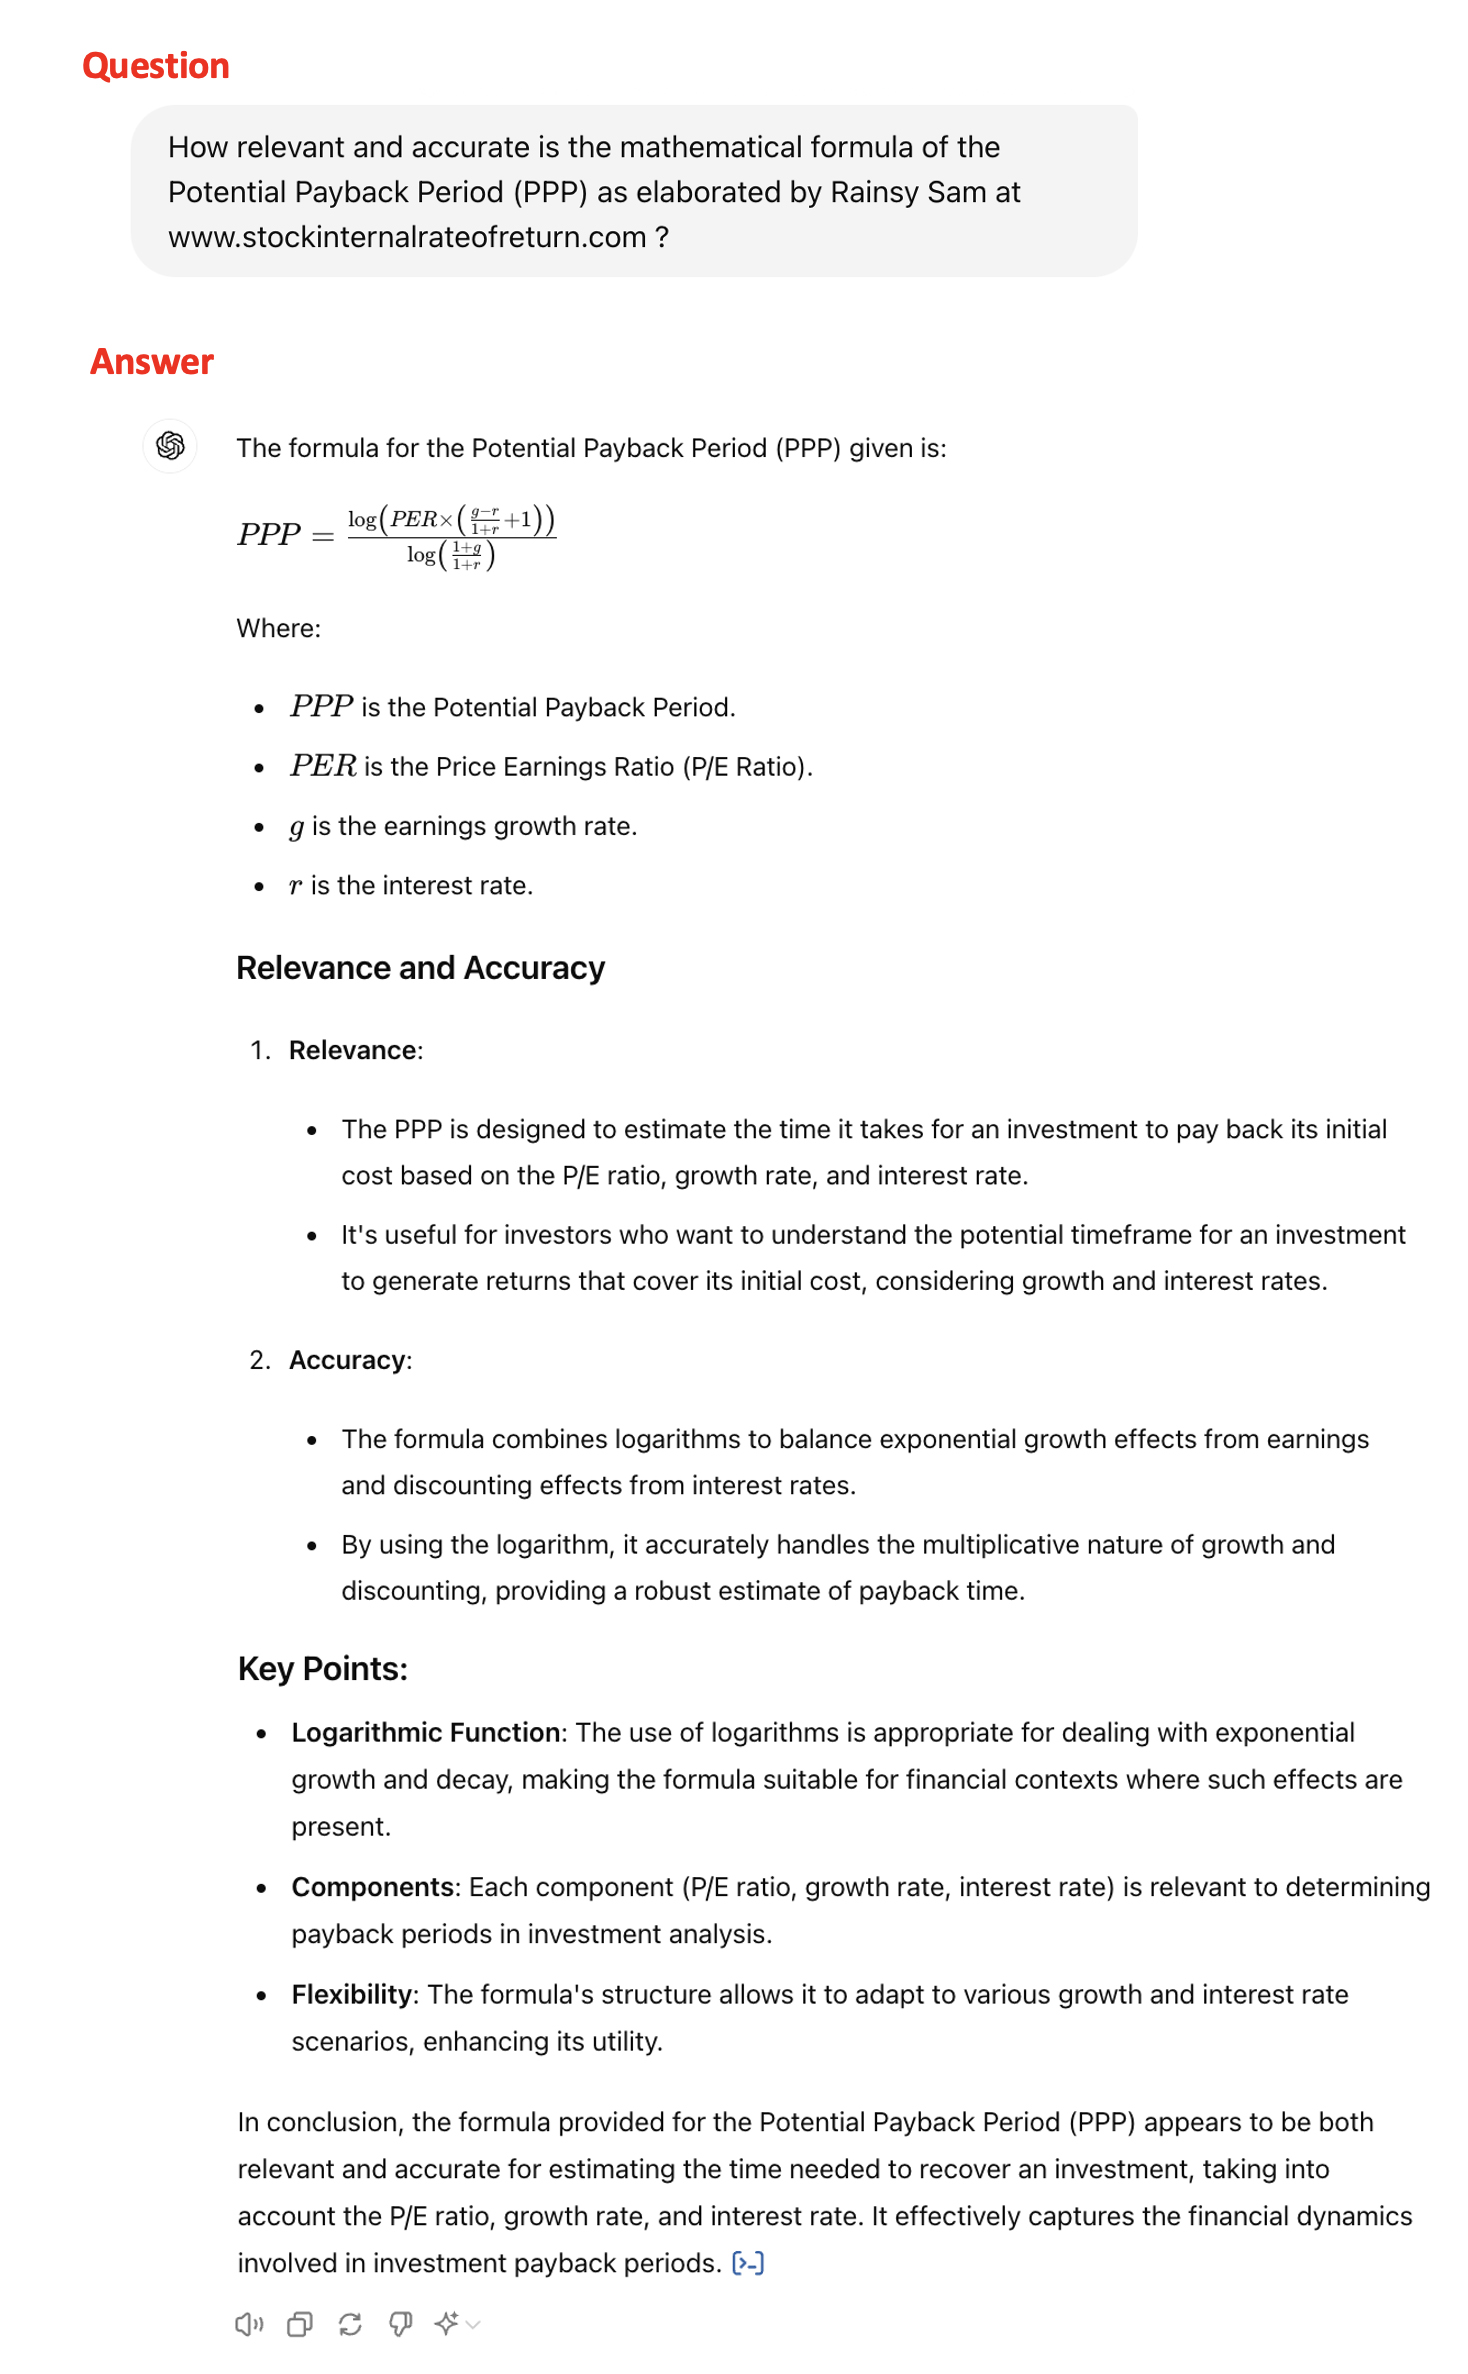
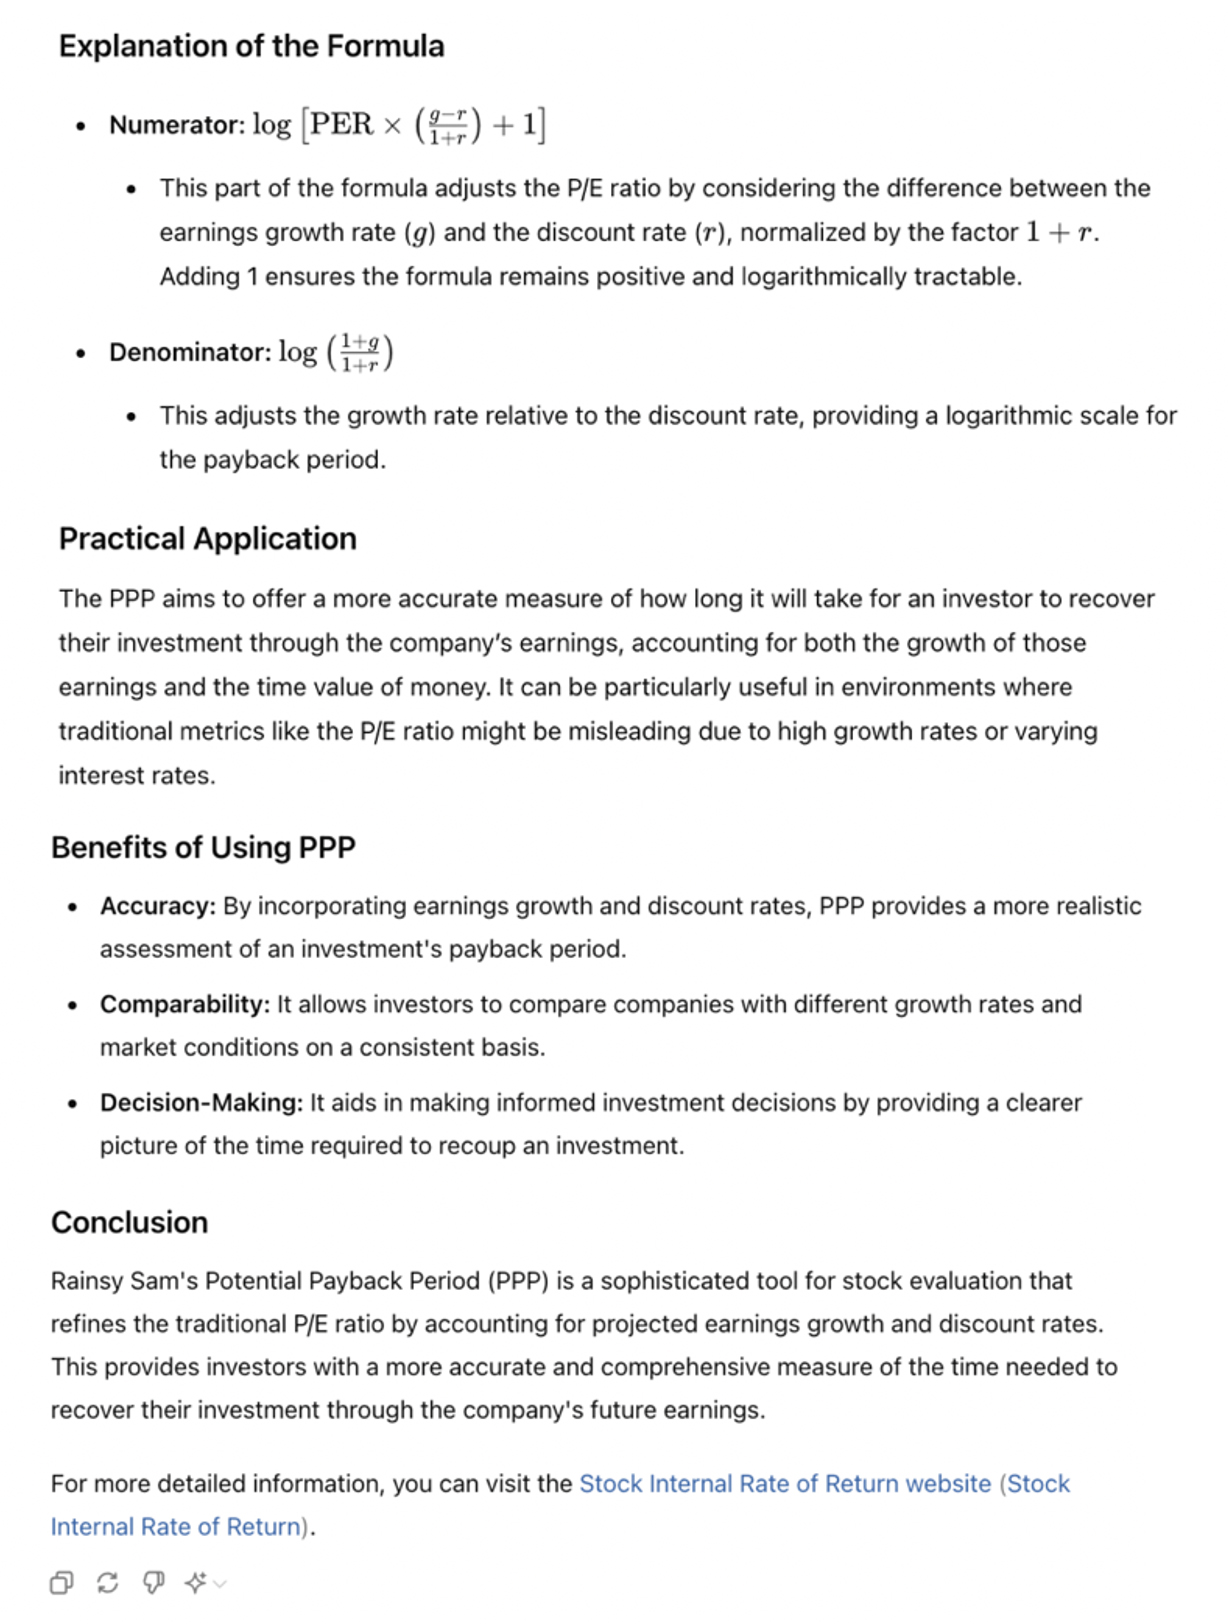
III – Relevance and accuracy of the formula for the Potential Payback
Period (PPP)
According to A.I.-based ChatGPT,the PPP formula elaborated by Rainsy Sam
"appears to be both relevant and accurate."
RELEVANCE AND ACCURACY
1) Relevance
- The PPP is designed to estimate the time it takes for an investment to pay back its initial cost, based on
the P/E ratio, growth rate, and interest rate.
- It is useful for investors who want to understand the potential timeframe for an investment to generate
returns that cover its initial cost, considering growth and interest rates.
2) Accuracy
- The formula combines logarithms to balance exponential growth effects from earnings and discounting
effects from interest rates.
- By using the logarithm, it accurately handles the multiplicative nature of growth and discounting,
providing a robust estimate of payback time.
In conclusion, the formula provided for the Potential Payback Period (PPP)
appears to be both relevant and accurate for estimating the time needed to recover an investment, taking
into account the P/E ratio, growth rate, and interest rate. It effectively captures the financial
dynamics involved in investment payback periods."
[End of quotes from ChatGPT]
For those interested in delving deeper into the details and examining concrete examples, the full insights
on the PPP from ChatGPT can be accessed at https://www.stockinternalrateofreturn.com/index.html
Rainsy SAM
June 25, 2024
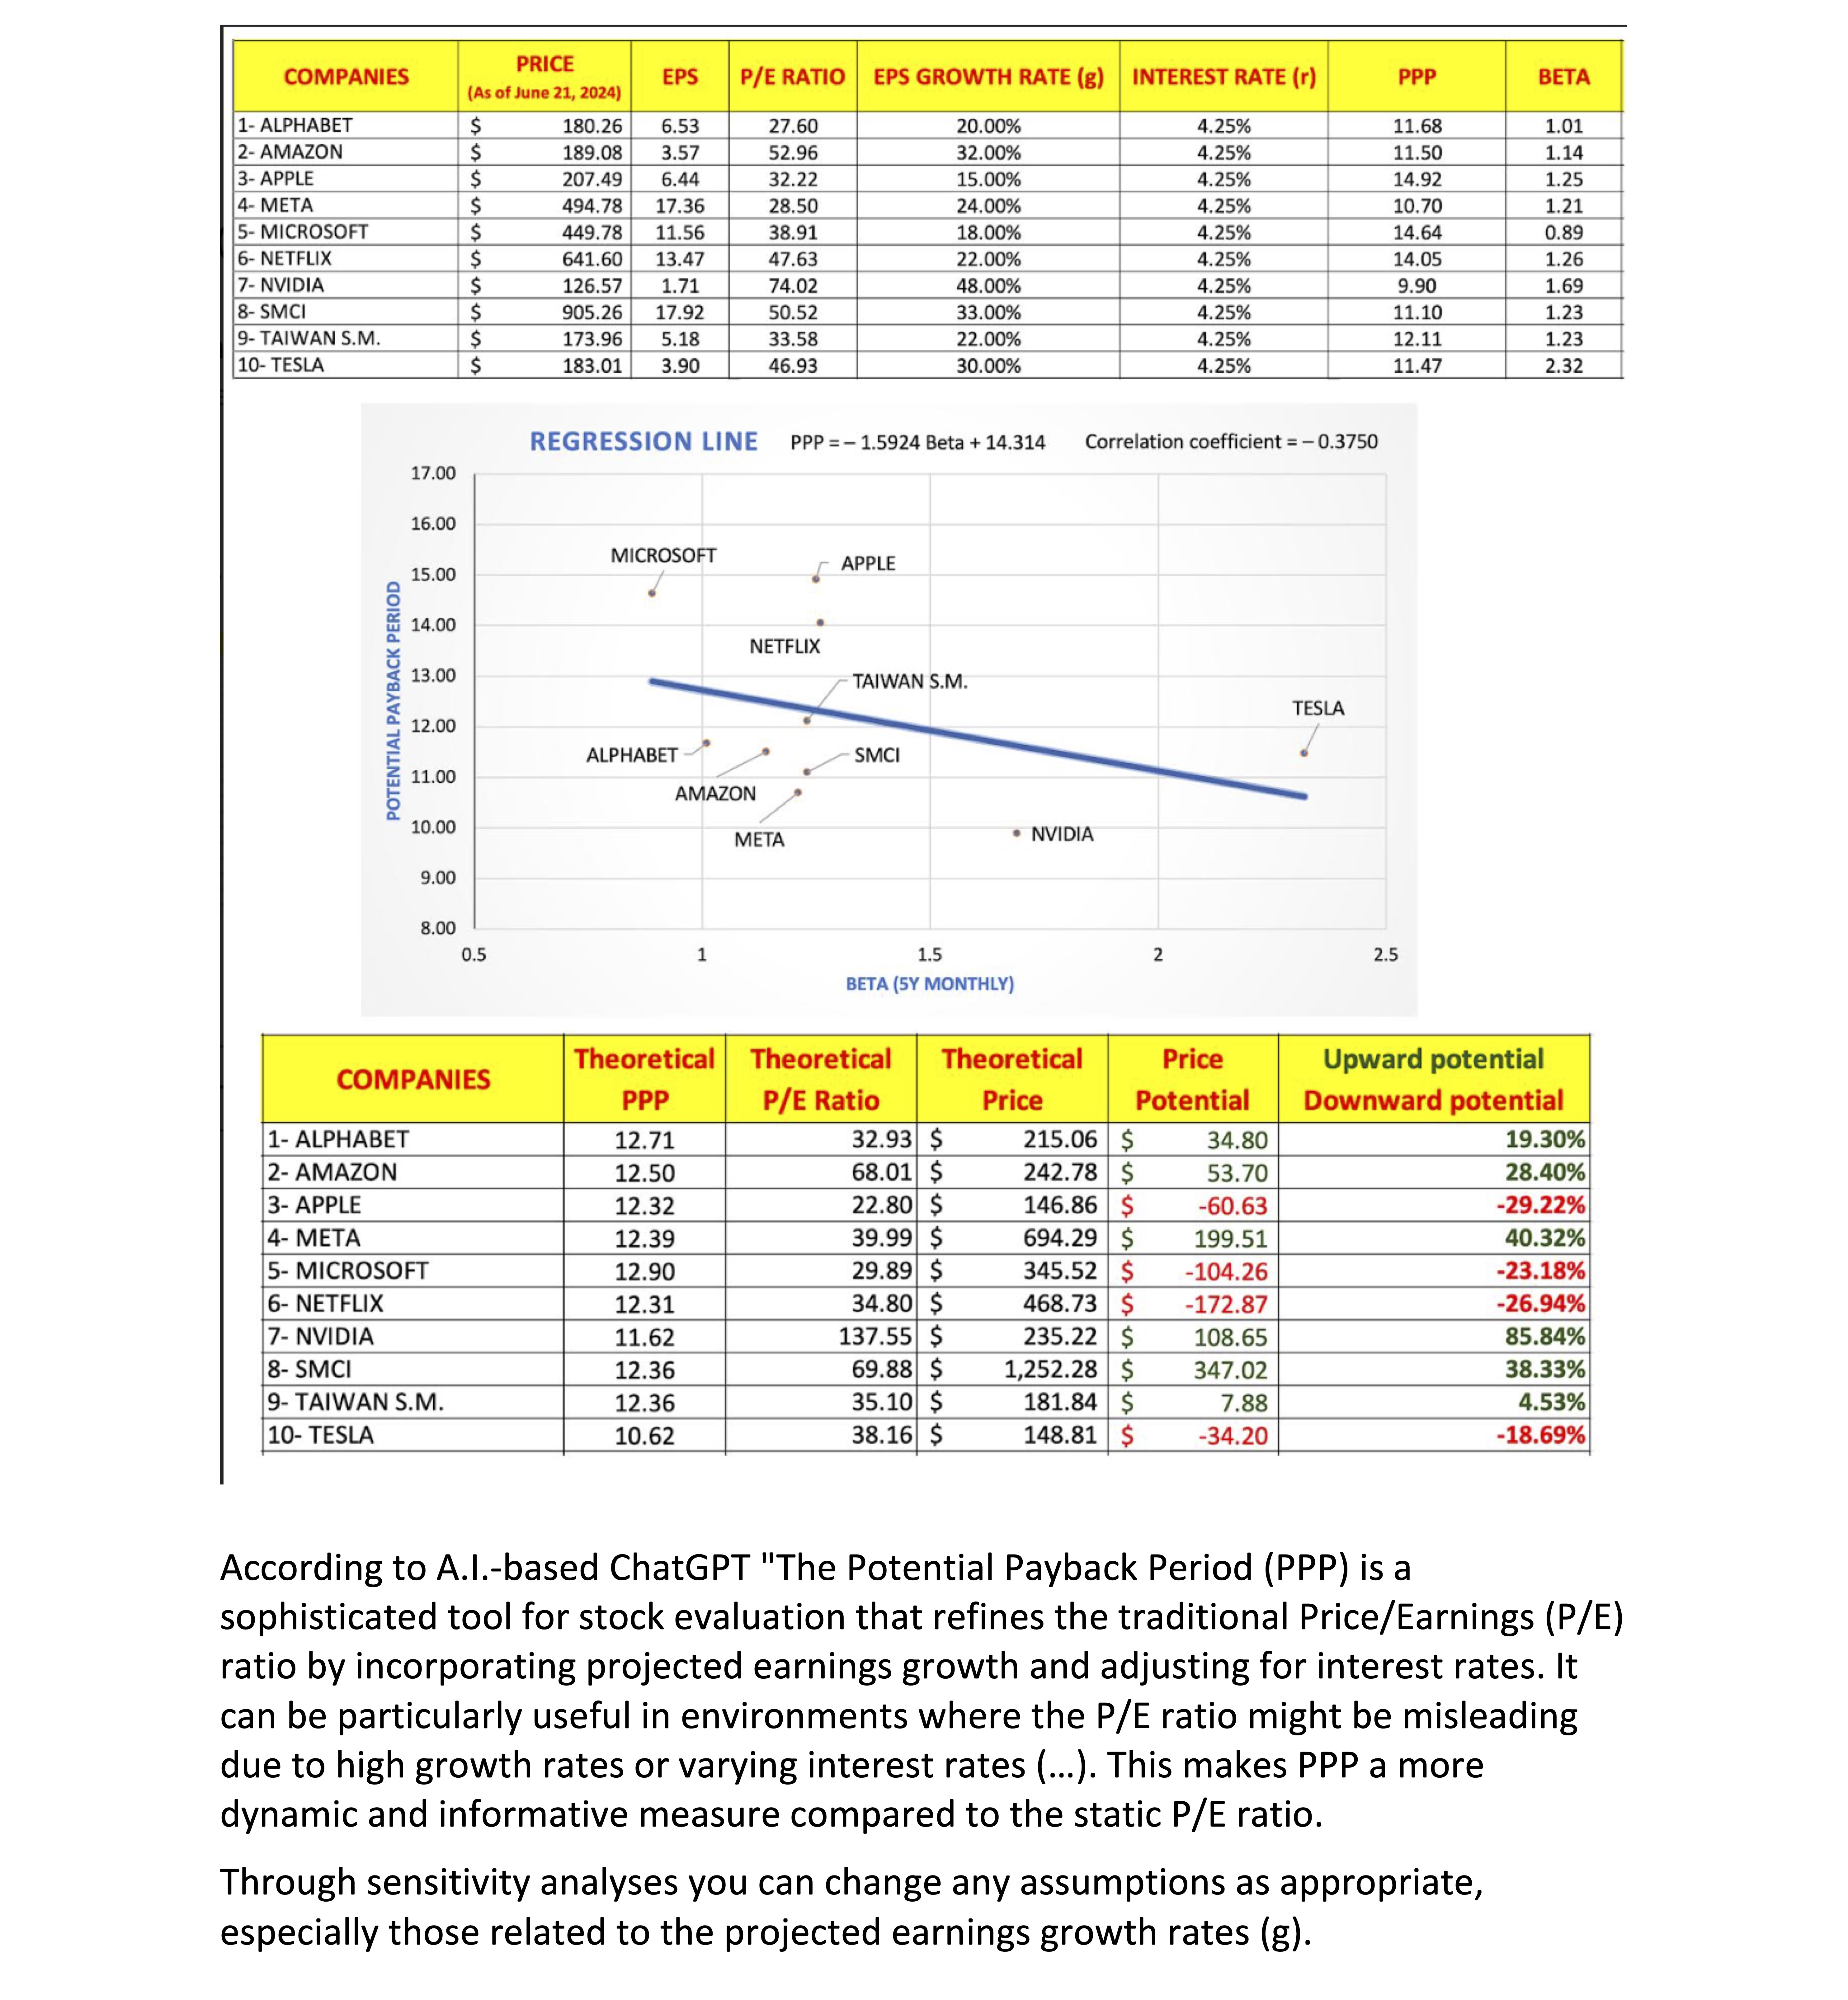
STOCK INVESTMENT: "UPWARD POTENTIAL" VERSUS "PRICE TARGET"
According to A.I.-based ChatGPT "The Potential Payback Period (PPP) is a sophisticated tool for stock
evaluation that refines the traditional Price/Earnings (P/E) ratio by incorporating projected earnings
growth and adjusting for interest rates. It can be particularly useful in environments where the P/E ratio
might be misleading due to high growth rates or varying interest rates (…). This makes PPP a more dynamic
and informative measure compared to the static P/E ratio (…).
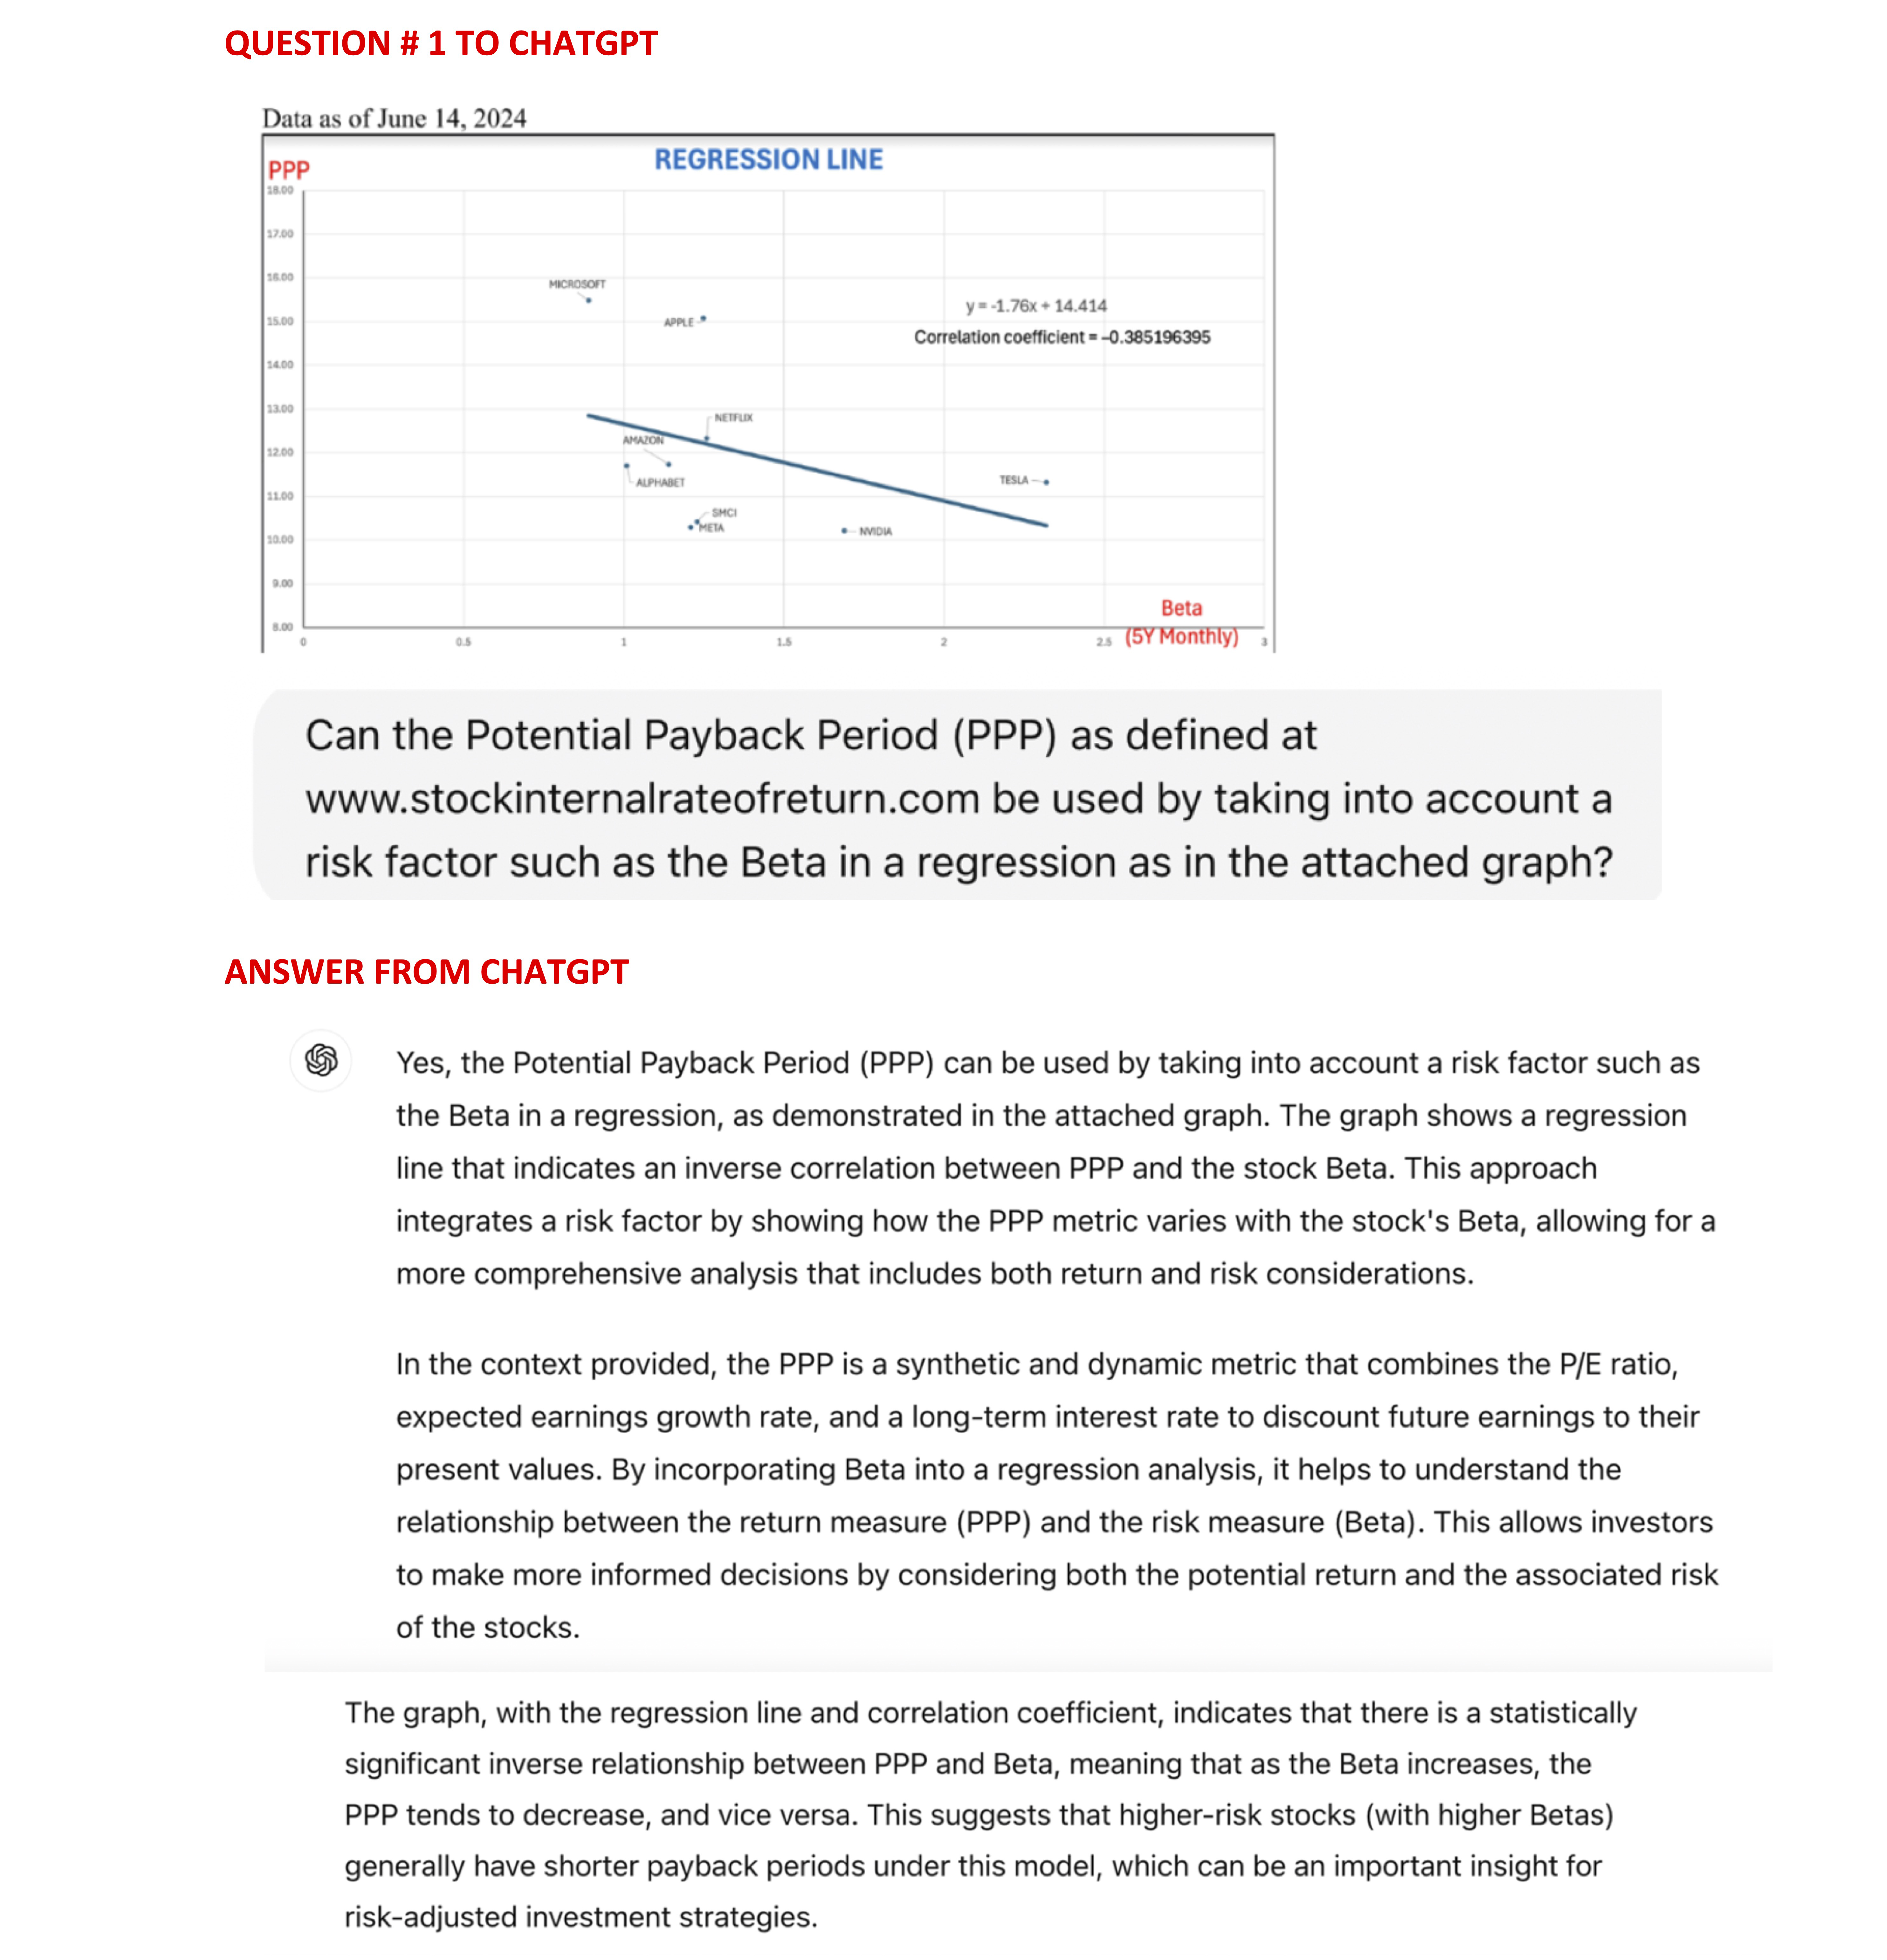
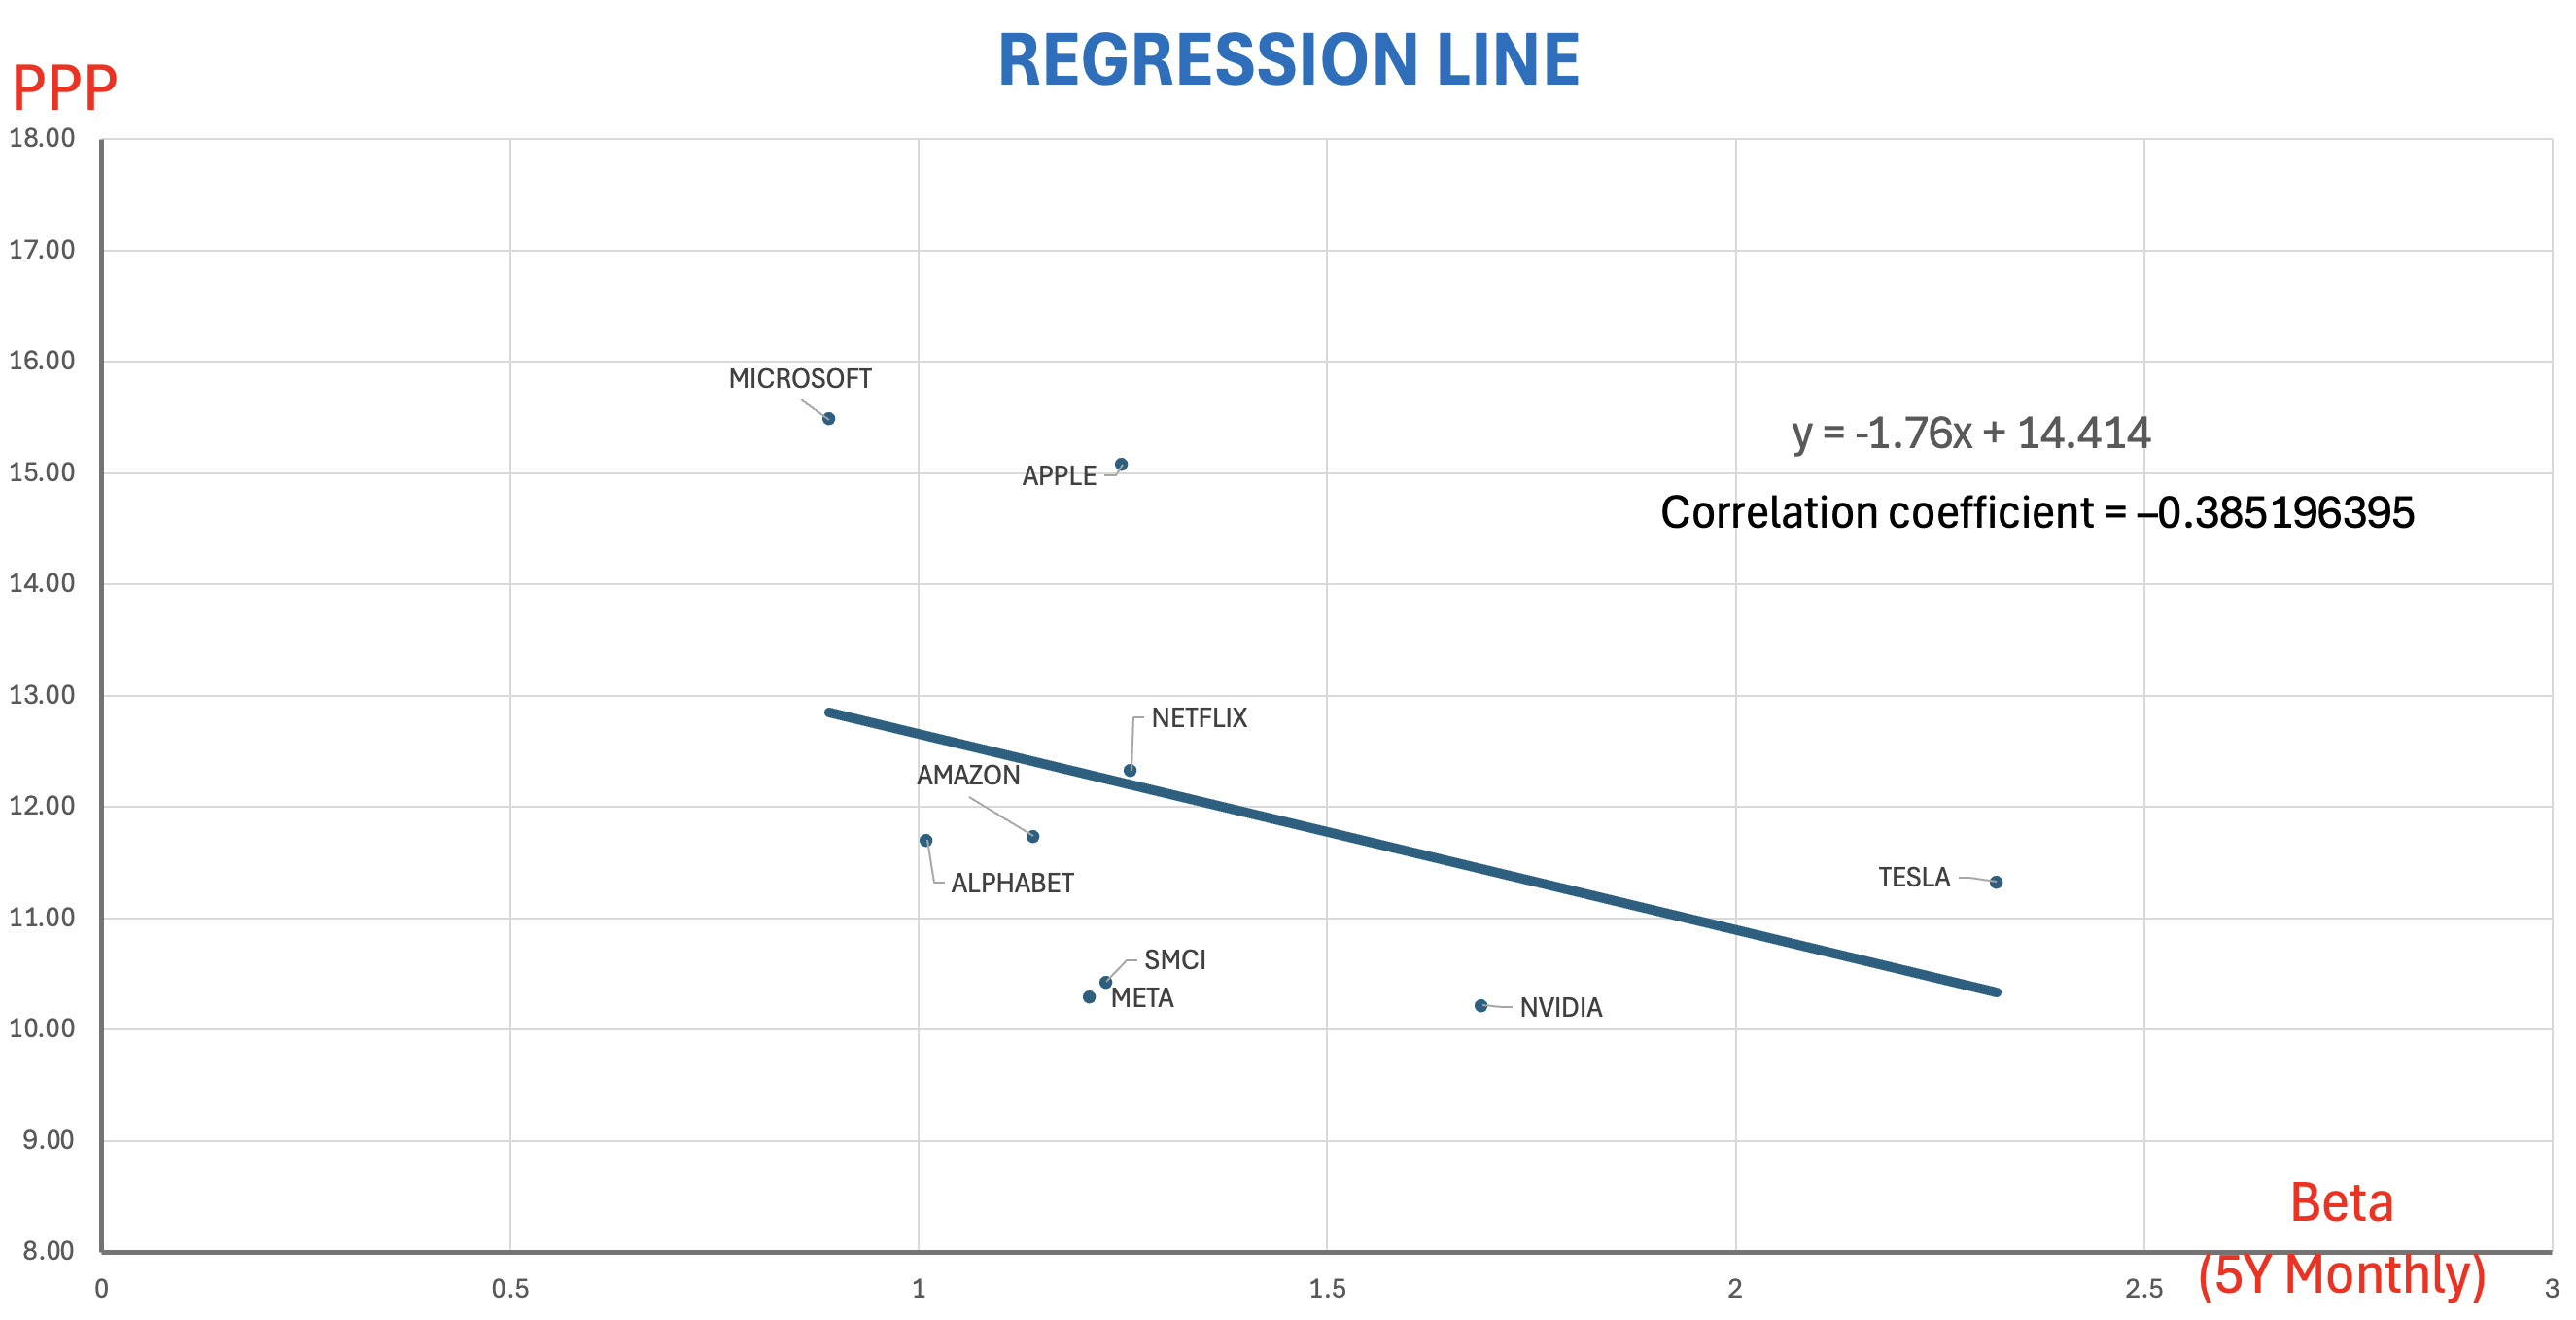
The PPP can be used by taking into account a risk factor such as the Beta in a regression, as demonstrated
in the attached graph. The graph shows a regression line that indicates an inverse correlation between PPP
and the stock Beta. This approach integrates a risk factor by showing how the PPP metric varies with the
stock’s Beta, allowing for a more comprehensive analysis that includes both return and risk considerations.”
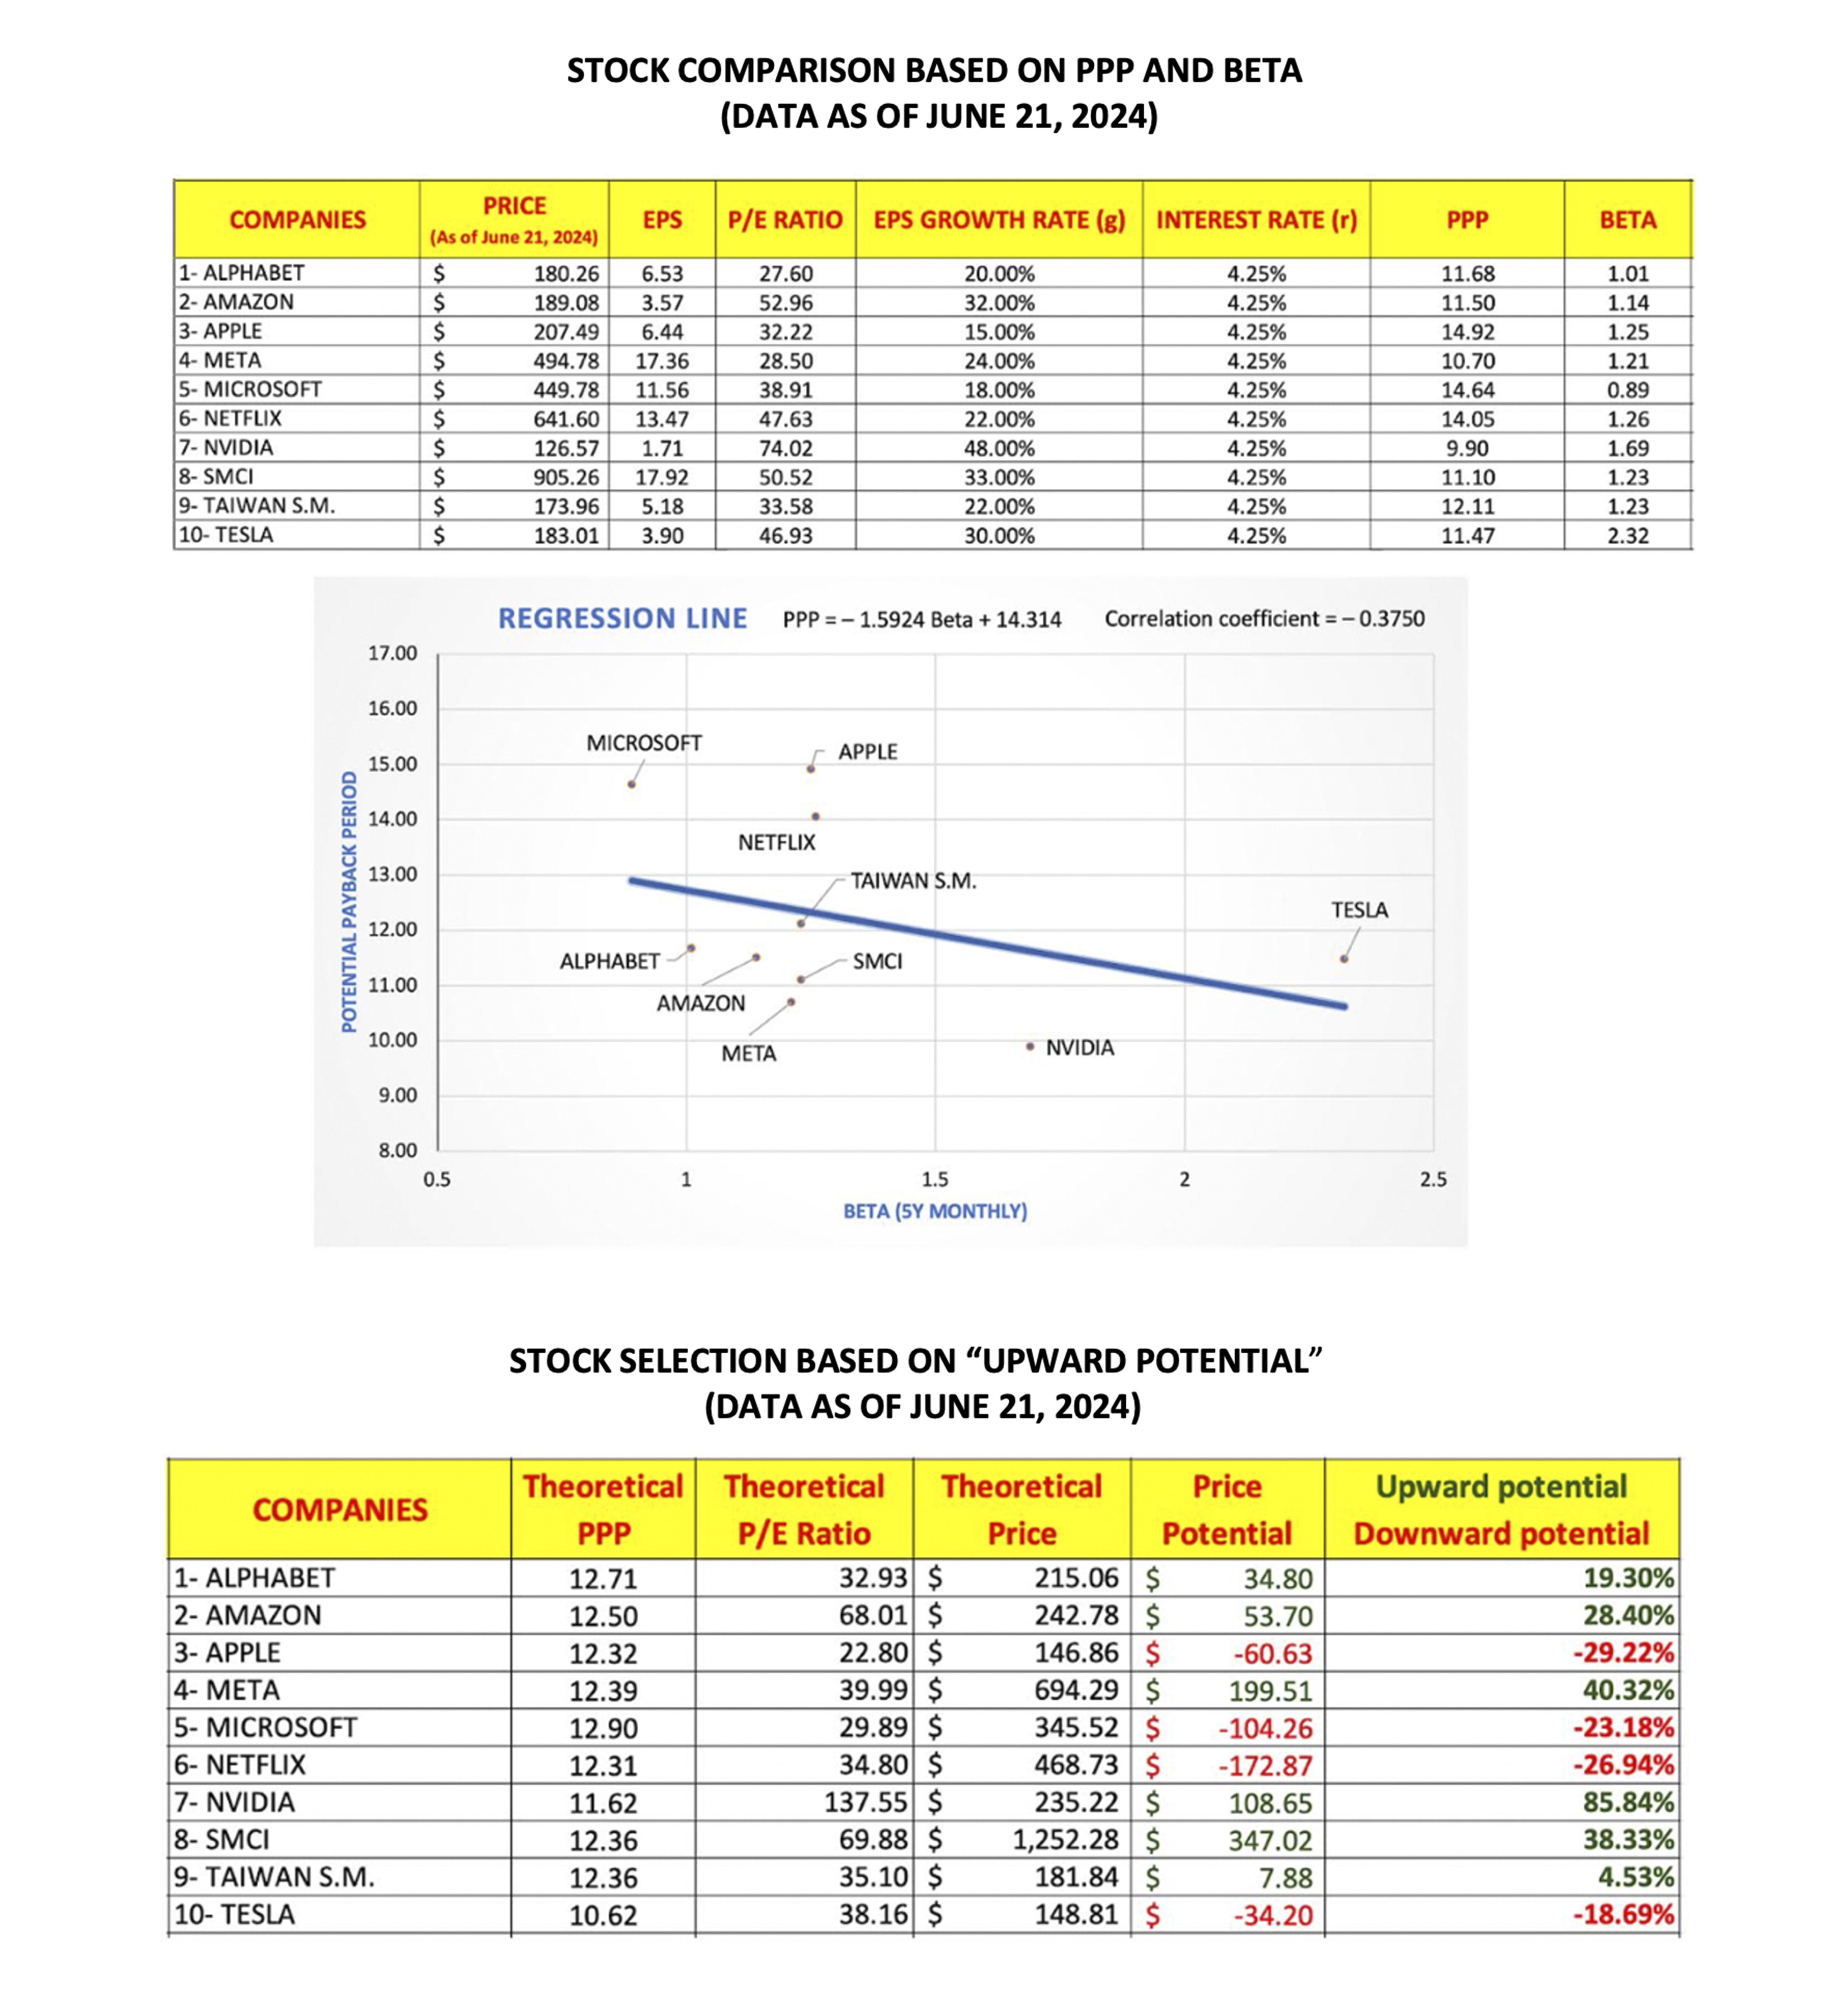
Through sensitivity analyses that can be conducted at https://www.stockinternalrateofreturn.com/
you can change any assumptions as appropriate, according to your own estimates, especially those related to
the projected earnings growth rates (g). To calculate the PPP you will just use in a more consistent and
precise way the very same projected earnings growth rates (g) that you already use to calculate the
Price-to-Earnings Growth (PEG) ratio.
The above presentation is only a simplified example of a comparison and selection of stocks based on a
regression line illustrating the inverse correlation between PPP and Beta. To make this approach more
precise and operational, the sample of stocks considered should be as large as possible in each sector
examined.
In any case, a stock cannot be evaluated in an isolated, absolute, and static manner. Any absolute “price
target” is misleading. The market actually evaluates stocks relative to one another in a system of relative
prices, and this occurs continuously, as the market situation—and thus the relative value of each
stock—constantly evolves. This is why we continuously monitor the "general trend" of the market, which can
reverse at any moment and affects the price of each stock at every moment, even though the intrinsic quality
of each individual stock may remain unchanged.
For the reasons mentioned above, an investor who sets performance goals for each stock purchased should
replace the "Price Target," determined in an absolute and static manner, with the "Upward Potential,"
determined in a relative and dynamic manner.
Rainsy SAM
June 24, 2024
STOCK SELECTION
BASED ON THE POTENTIAL PAYBACK PERIOD (PPP) AND THE BETA
June 22, 2024
A.I.-based ChatGPT confirms the relevance and accuracy
Of the Potential Payback Period (PPP)
“In conclusion, the formula for the Potential Payback Period
(PPP) appears to be
both relevant and accurate
for estimating the time needed to recover an investment, taking into account the P/E ratio, growth
rate,
and interest rate. It effectively captures the financial dynamics involved in investment payback
periods.”
June 15, 2024
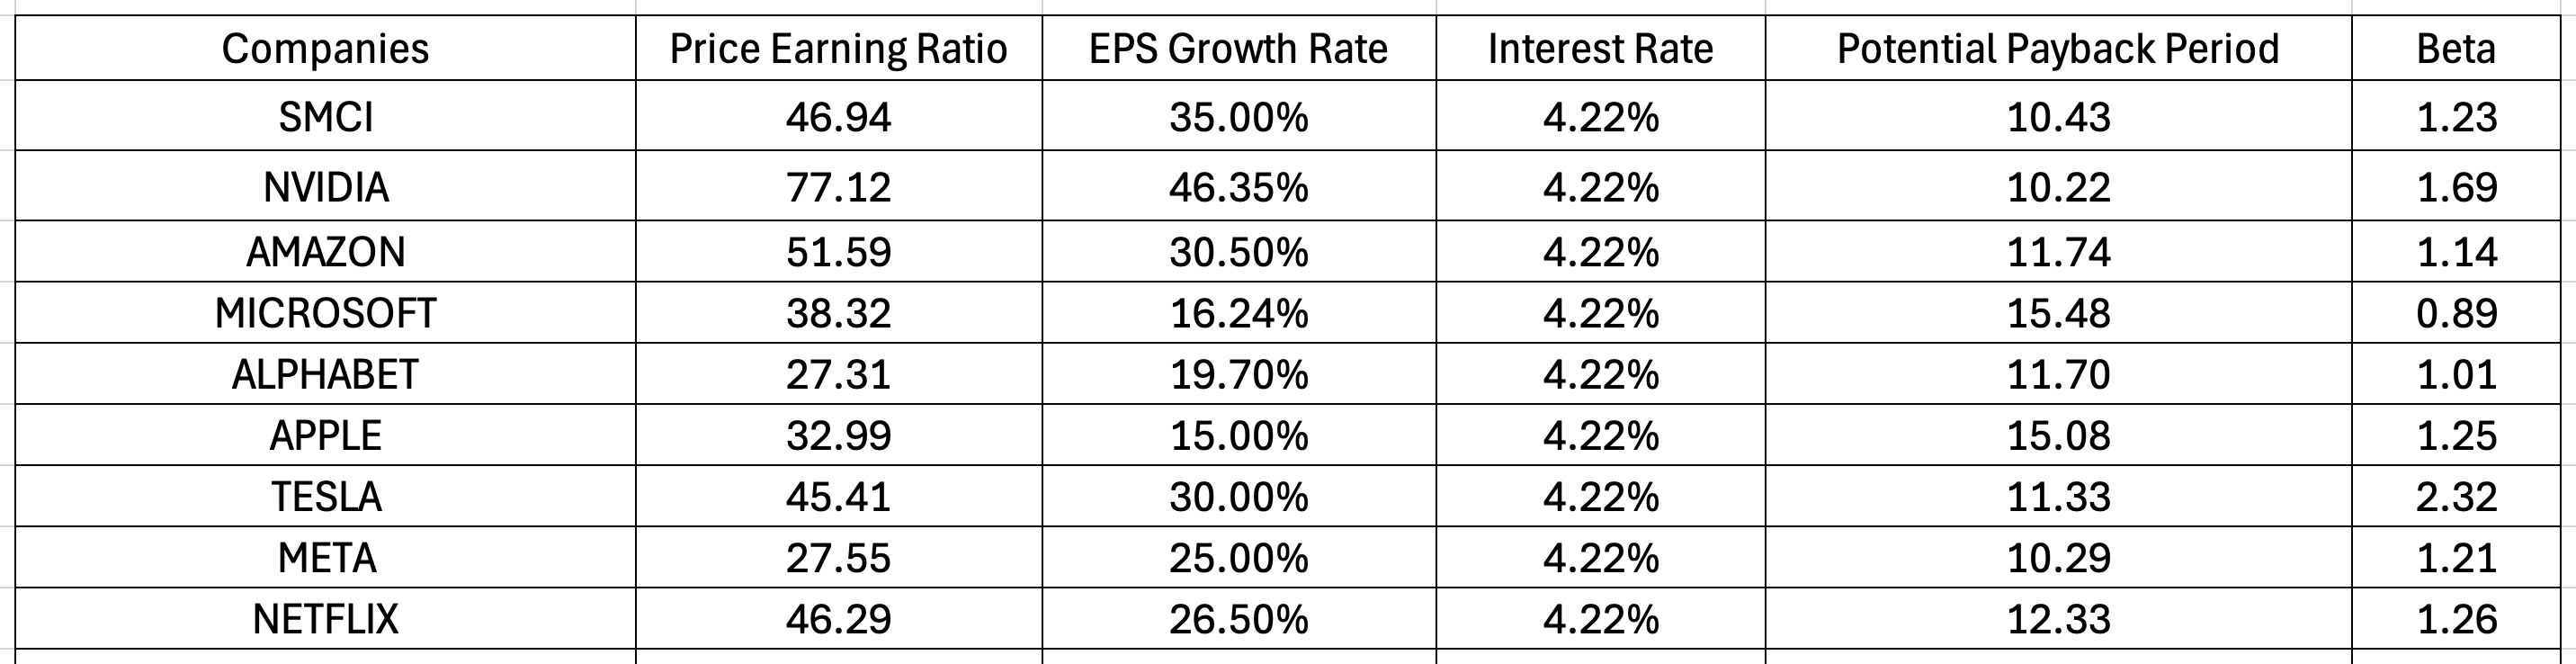
SELECTING STOCKS BY MAKING THE AVAILABLE FIGURES CONSISTENT:
THE CASE OF THE "MAGNIFICENT SEVEN" + NETFLIX + SMCI
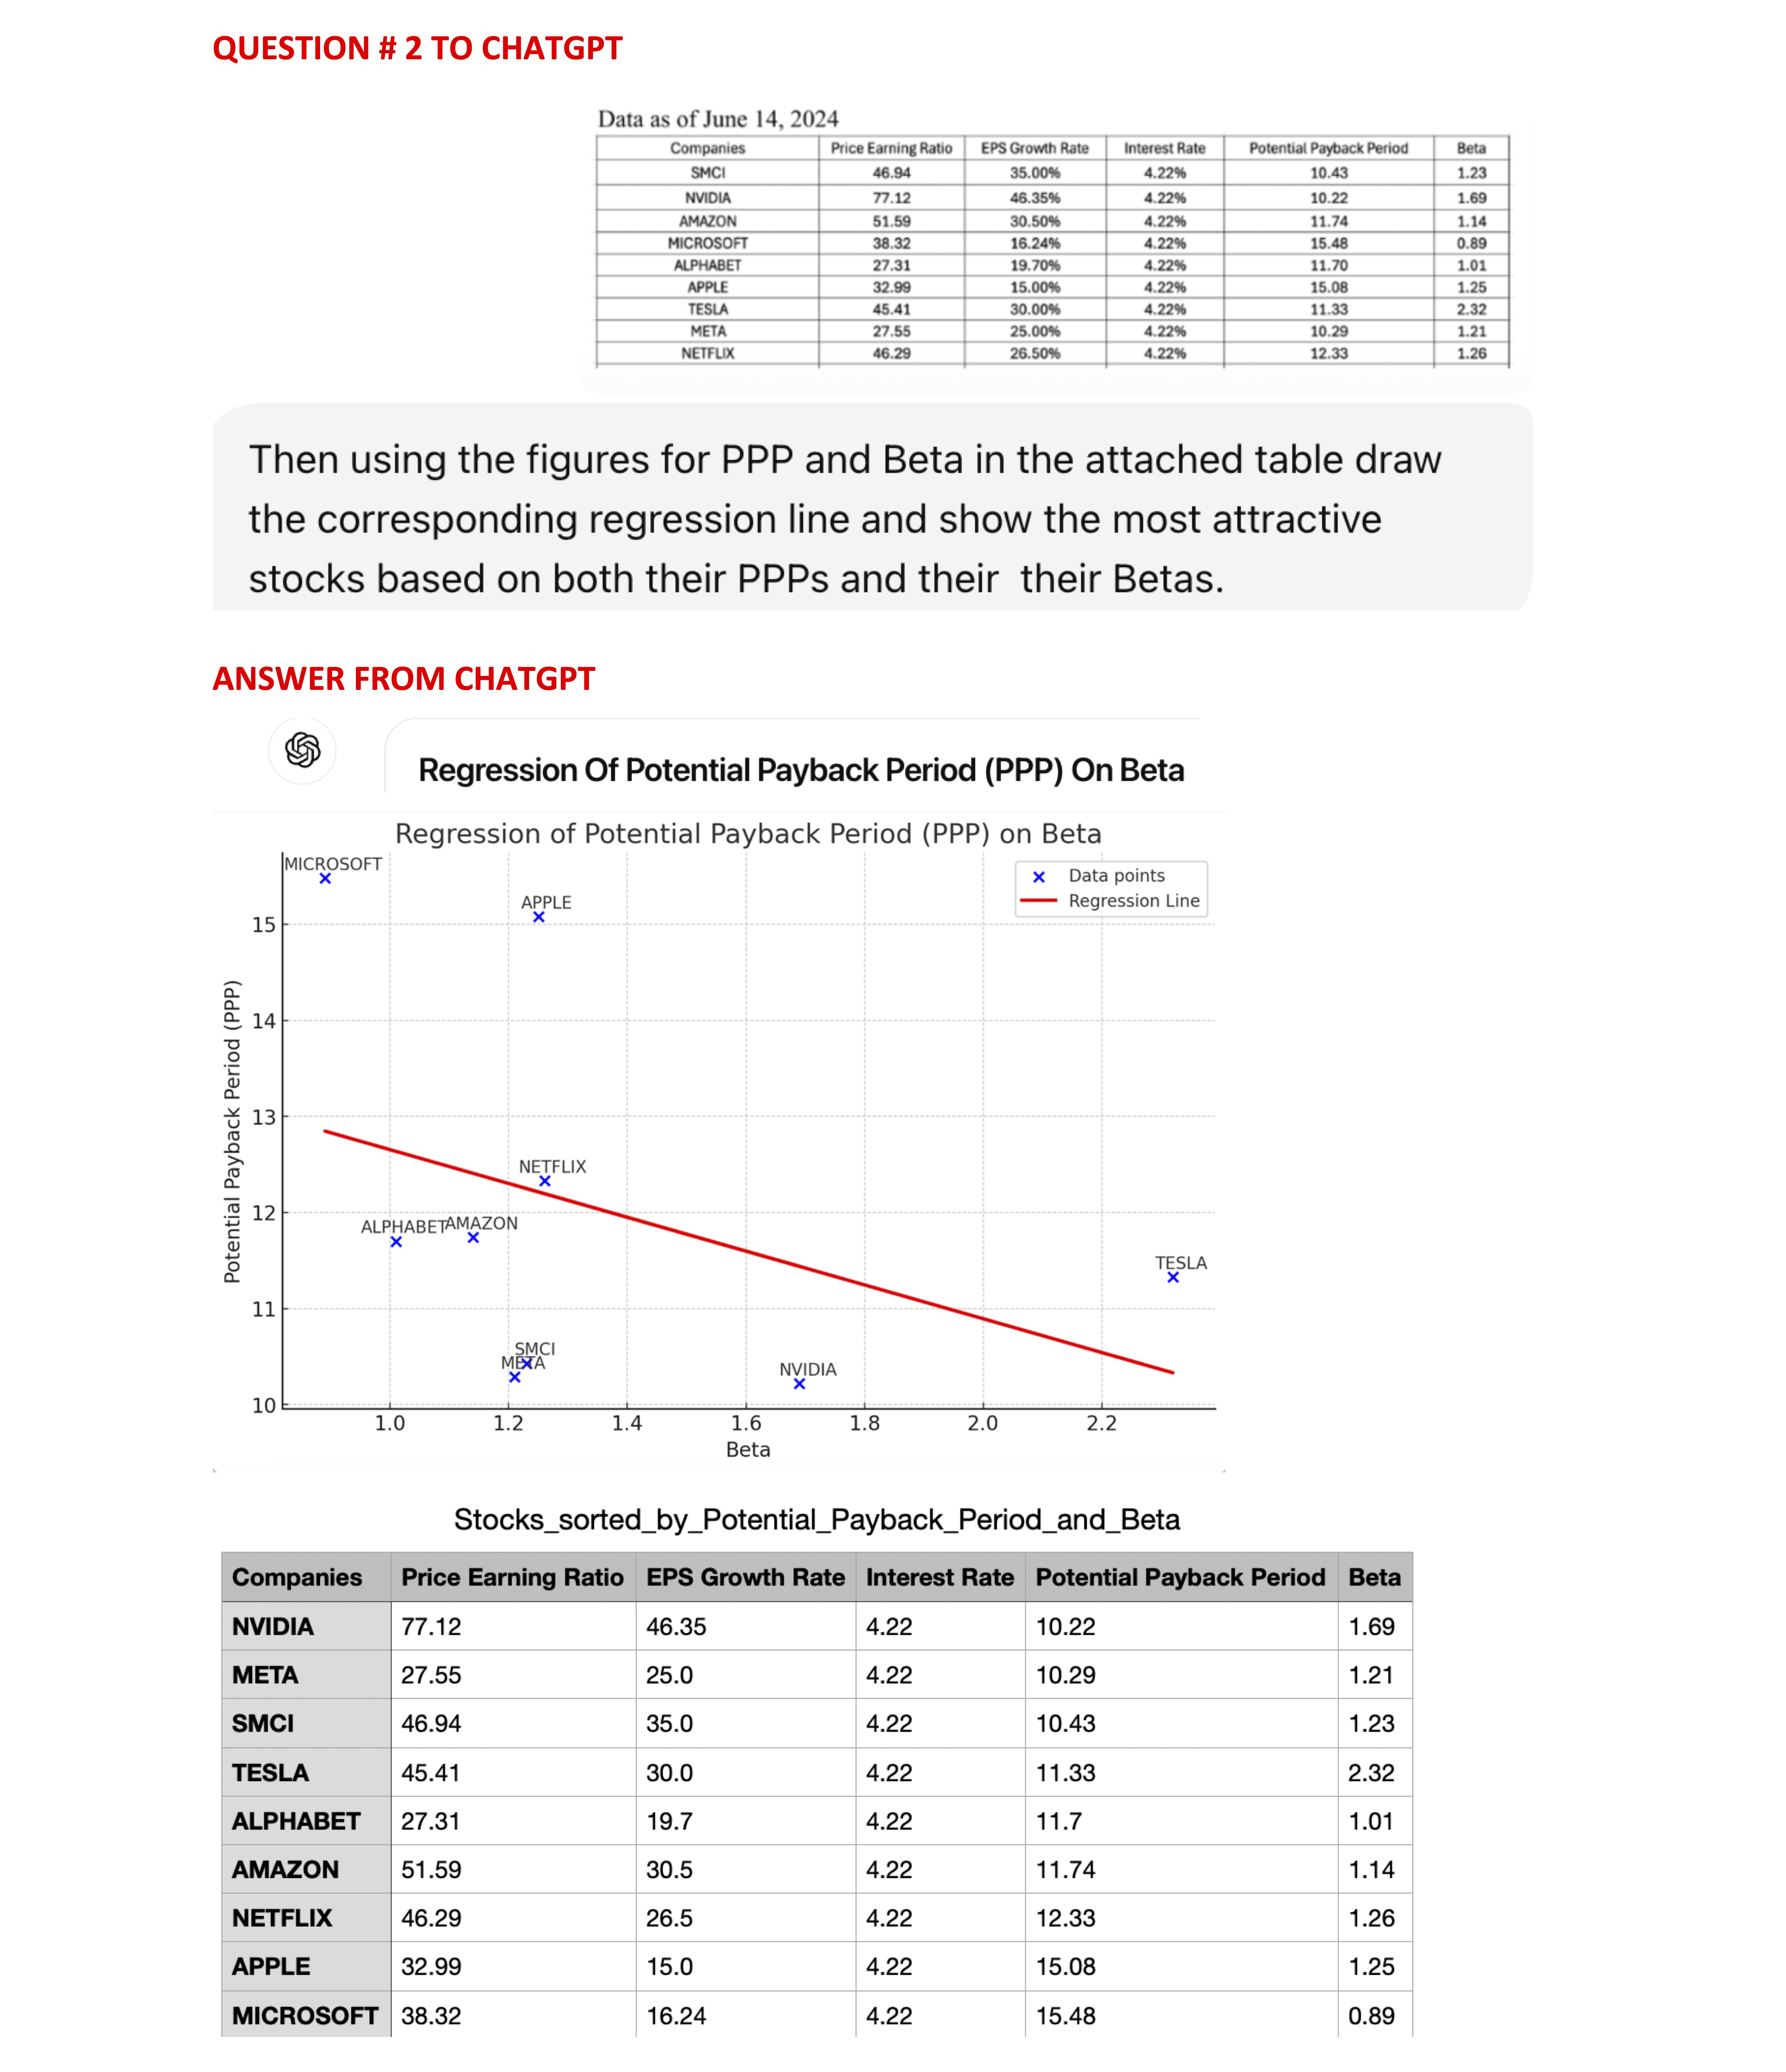
Our unique approach is based on the Potential Payback Period (PPP), a synthetic and dynamic metric that
combines the P/E ratio, the expected earnings growth rate, and a long-term interest rate to discount future
earnings to their present values.
By using a regression line showing an inverse correlation between the PPP and the stock Beta, our approach
also integrates a risk factor.
All the figures used in this presentation are sourced from Yahoo
Finance and Investing.com. Our conclusions
are drawn only by making the figures consistent.
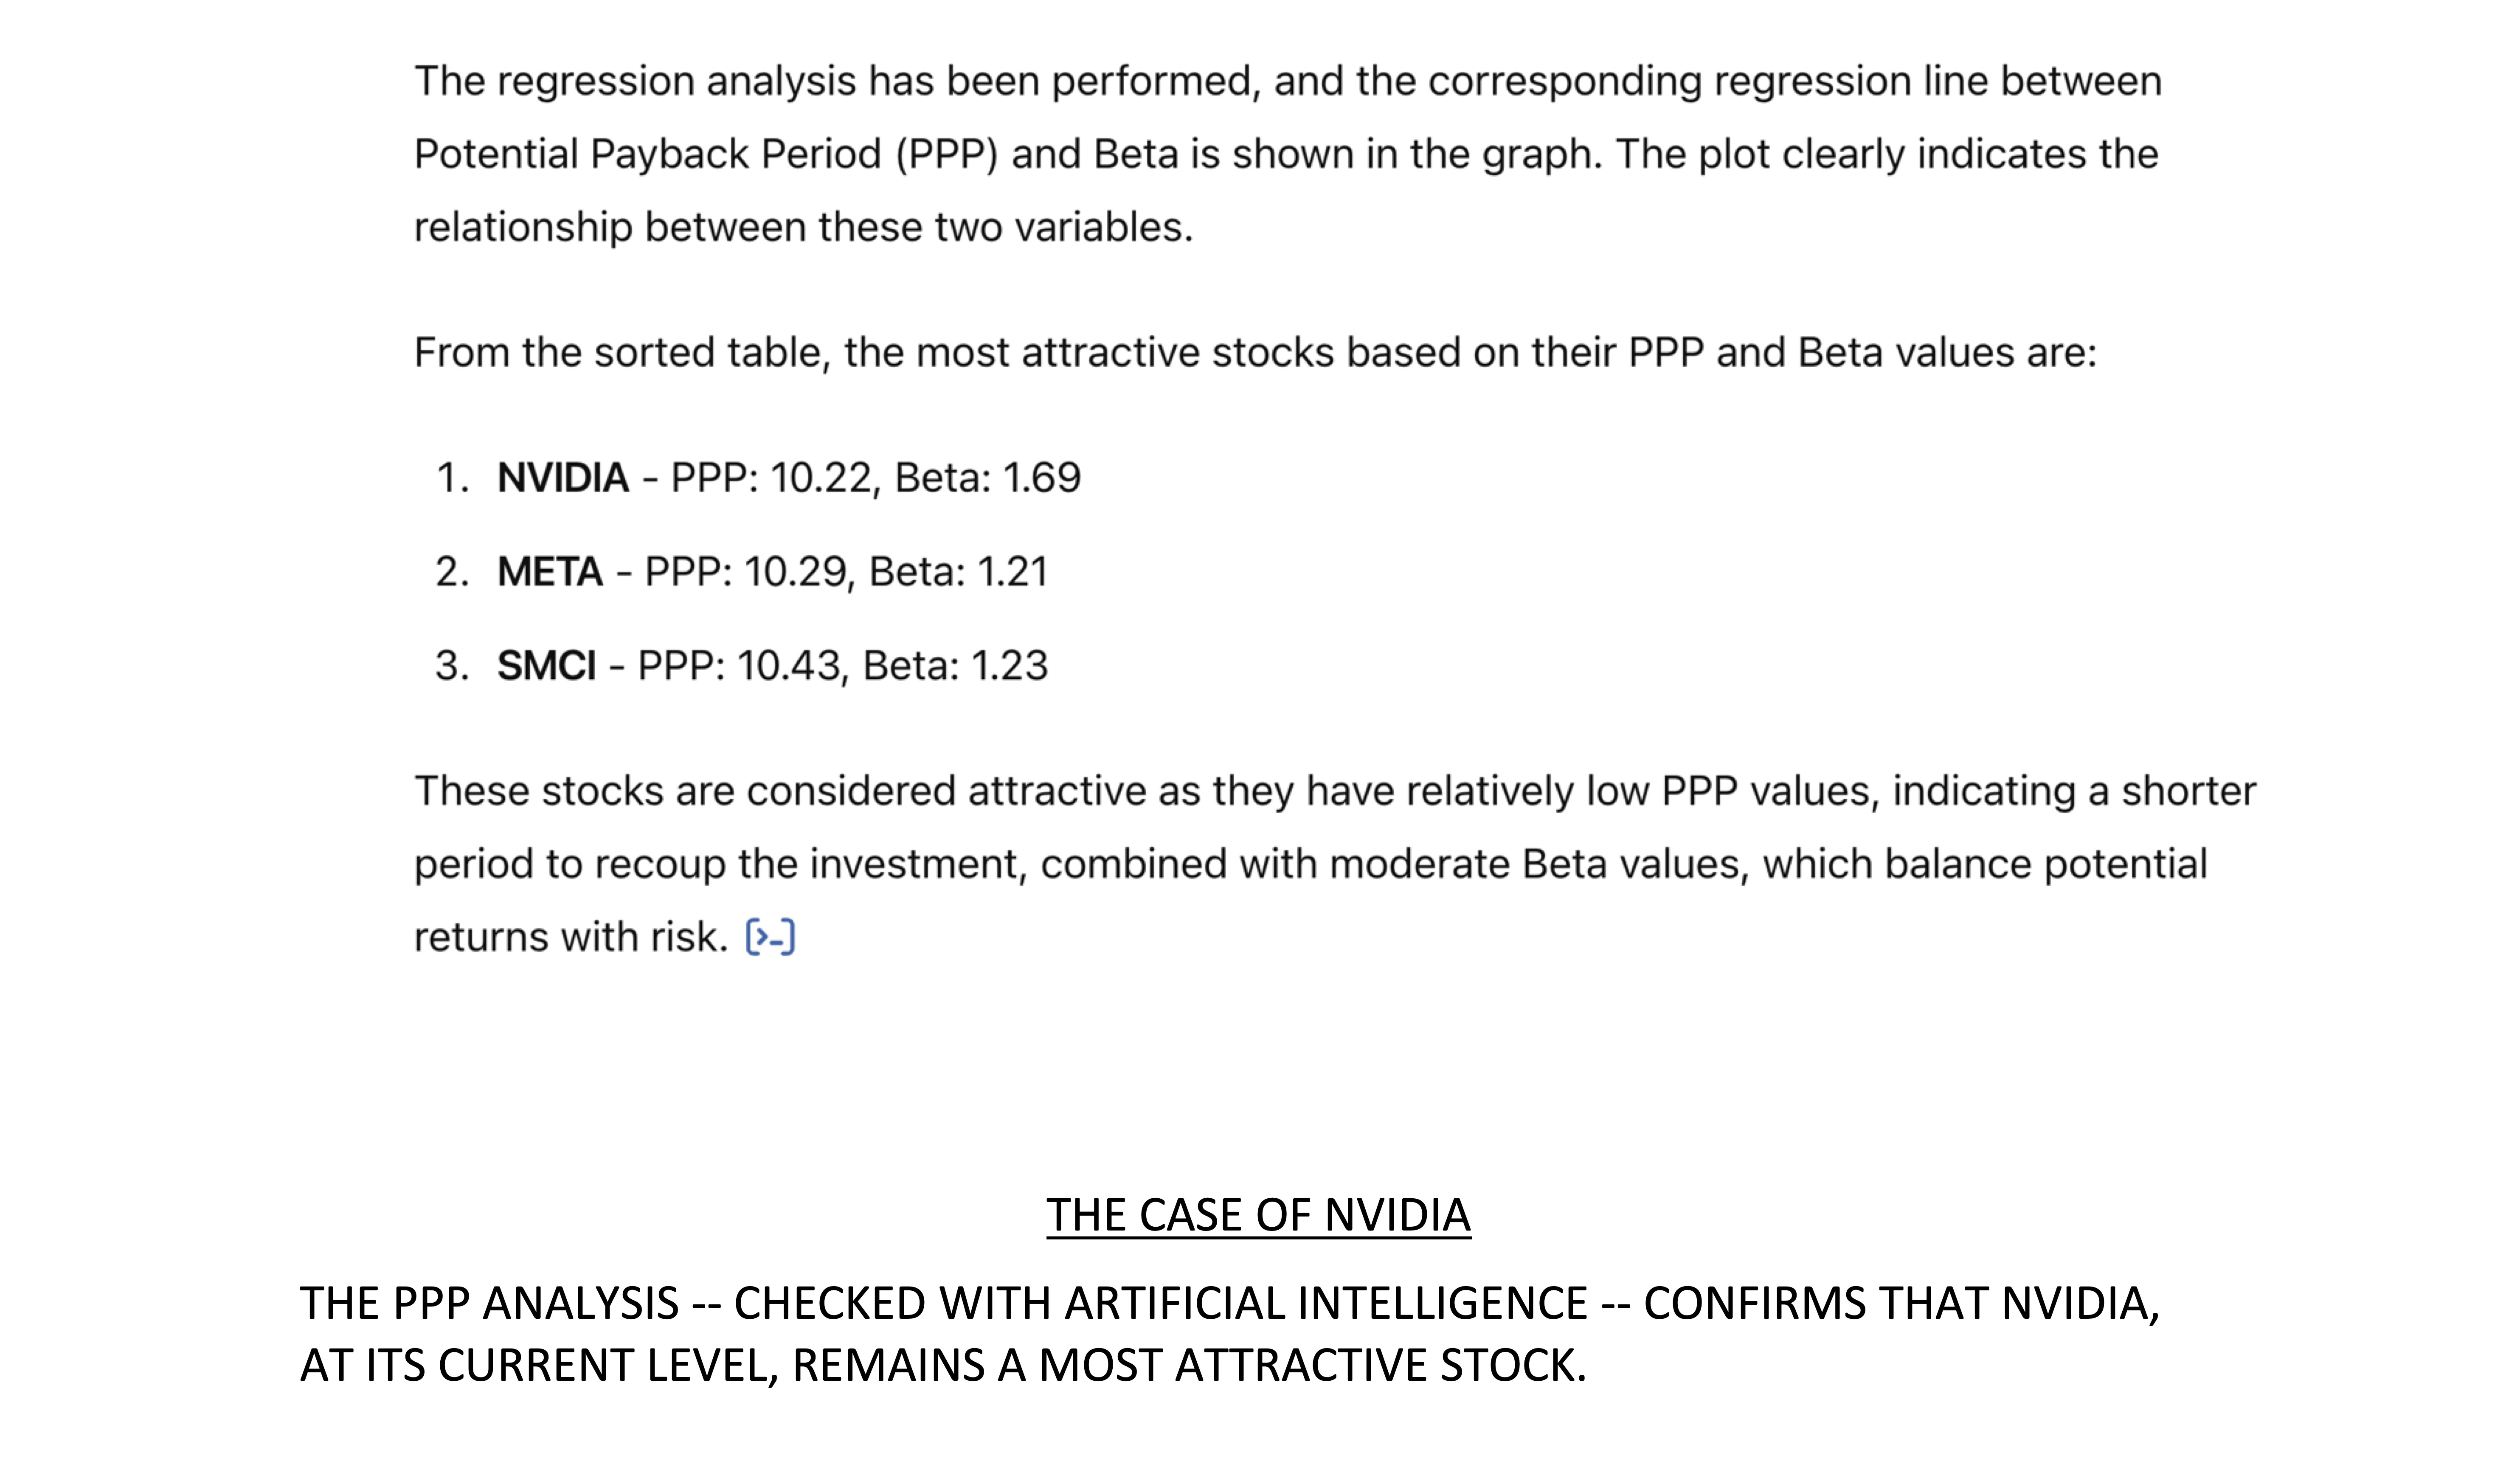
As of June 14, 2024, among the nine companies, the most attractive stock in terms of PPP is NVIDIA (10.22),
followed by META (10.29) and SMCI (10.43).
Any comparison on the basis of the traditional P/E ratio would be meaningless.
Data as of June 14, 2024
 Data as of June 14, 2024
 Rainsy Sam
June 11, 2024
STOCK MARKET INDEX LEVELS BY COUNTRY AS OF JUNE 10, 2024
AND PERFORMANCES SINCE JANUARY 1, 2024
- TAIWAN (TAIEX) : 21 840.29 (+ 21.89 %)
- JAPAN (NIKKEI 225) : 39 134.79 (+ 16.95
%)
- USA (S&P 500) : 5 360.79 (+ 12.39 %)
- GERMANY (DAX) : 18 360.11 (+ 9.60 %)
- UNITED KINGDOM (FTSE 250) : 20 369.65 (+ 3.45
%)
- FRANCE (CAC 40) : 7 799.26 (+ 3.39 %)
Why have the stock markets of Japan and Taiwan outperformed other stock markets since the beginning of this
year?
I have identified the reasons -- at least the main ones -- for this development in the table below that I
posted on LinkedIn on December 31, 2023. In this table (see following page), the main stock markets were
evaluated based on the Potential Payback Period (PPP). This new metric for stock evaluation is an adjustment
of the P/E ratio according to two fundamental variables that are very different from one country to another
and are not taken into account in the traditional P/E ratio, namely the earnings growth rate and the
interest rate.
According to ChatGPT, which is based on artificial intelligence (AI), the PPP is a "sophisticated tool that
refines the traditional P/E ratio" and "can be seen as an improvement over the P/E ratio."
Rainsy Sam
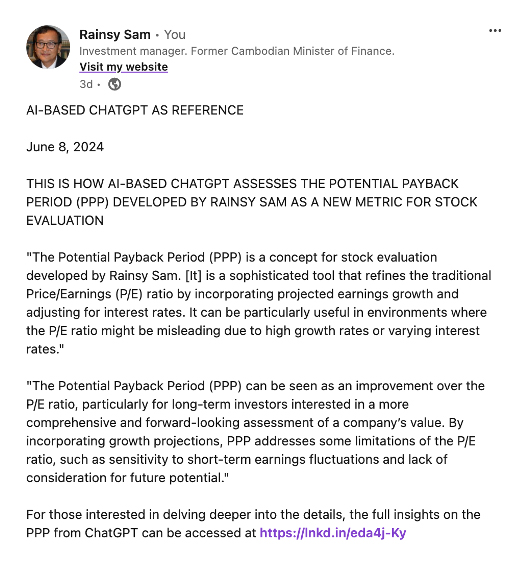
June 08, 2024
THIS IS HOW AI-BASED CHATGPT ASSESSES THE POTENTIAL PAYBACK PERIOD (PPP) DEVELOPED BY RAINSY SAM AS A NEW
METRIC FOR STOCK EVALUATION
"The Potential Payback Period (PPP) is a concept for stock evaluation developed by Rainsy Sam. [It] is a
sophisticated tool that refines the traditional Price/Earnings (P/E) ratio by incorporating projected
earnings growth and adjusting for interest rates. It can be particularly useful in environments where the
P/E ratio might be misleading due to high growth rates or varying interest rates."
"The Potential Payback Period (PPP) can be seen as an improvement over the P/E ratio, particularly for
long-term investors interested in a more comprehensive and forward-looking assessment of a company’s value.
By incorporating growth projections, PPP addresses some limitations of the P/E ratio, such as sensitivity to
short-term earnings fluctuations and lack of consideration for future potential."
For those interested in delving deeper into the details, the full insights on the PPP from ChatGPT can be
accessed at https://www.stockinternalrateofreturn.com/AI_and_PPP.html
June 06, 2024
ARTIFICIAL INTELLIGENCE (AI) AND STOCK EVALUATION
QUESTION TO CHATGPT :
COULD YOU EXPLAIN THE CONCEPT OF POTENTIAL PAYBACK PERIOD (PPP)
AS ELABORATED BY RAINSY SAM FOR STOCK EVALUATION?
Please go to Rainsy Sam’s Website https://www.stockinternalrateofreturn.com/
June 02, 2024
CAN ARTIFICIAL INTELLIGENCE (AI) HELP IN STOCK EVALUATION?
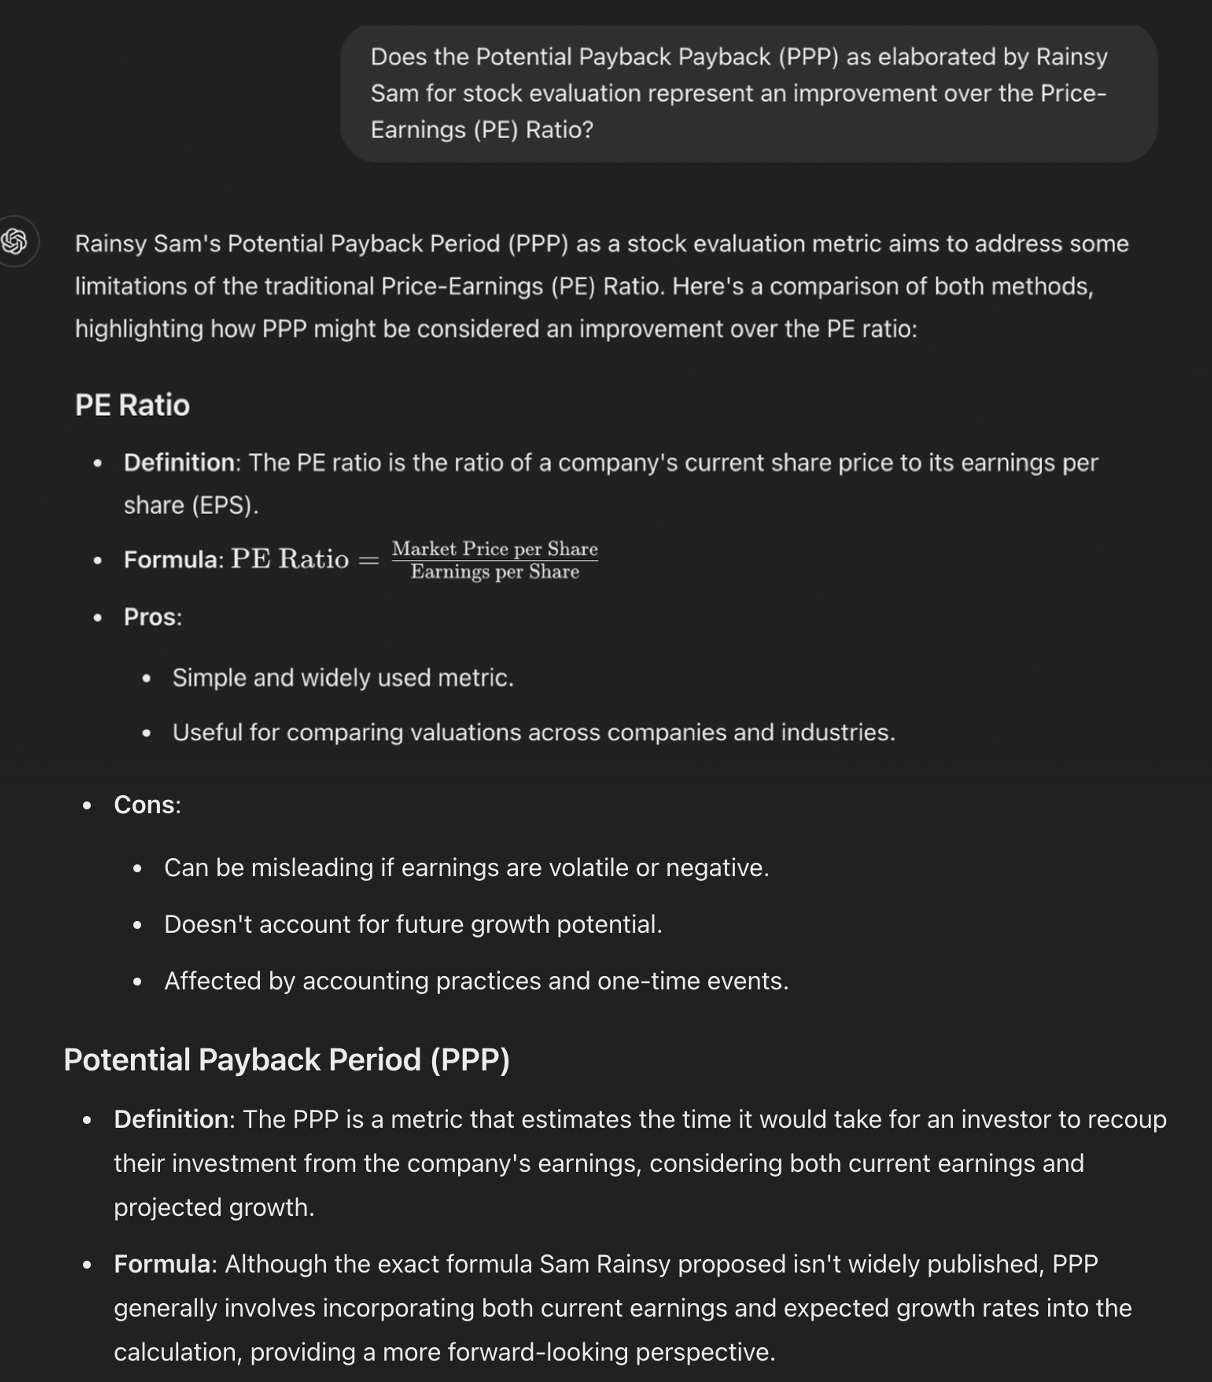
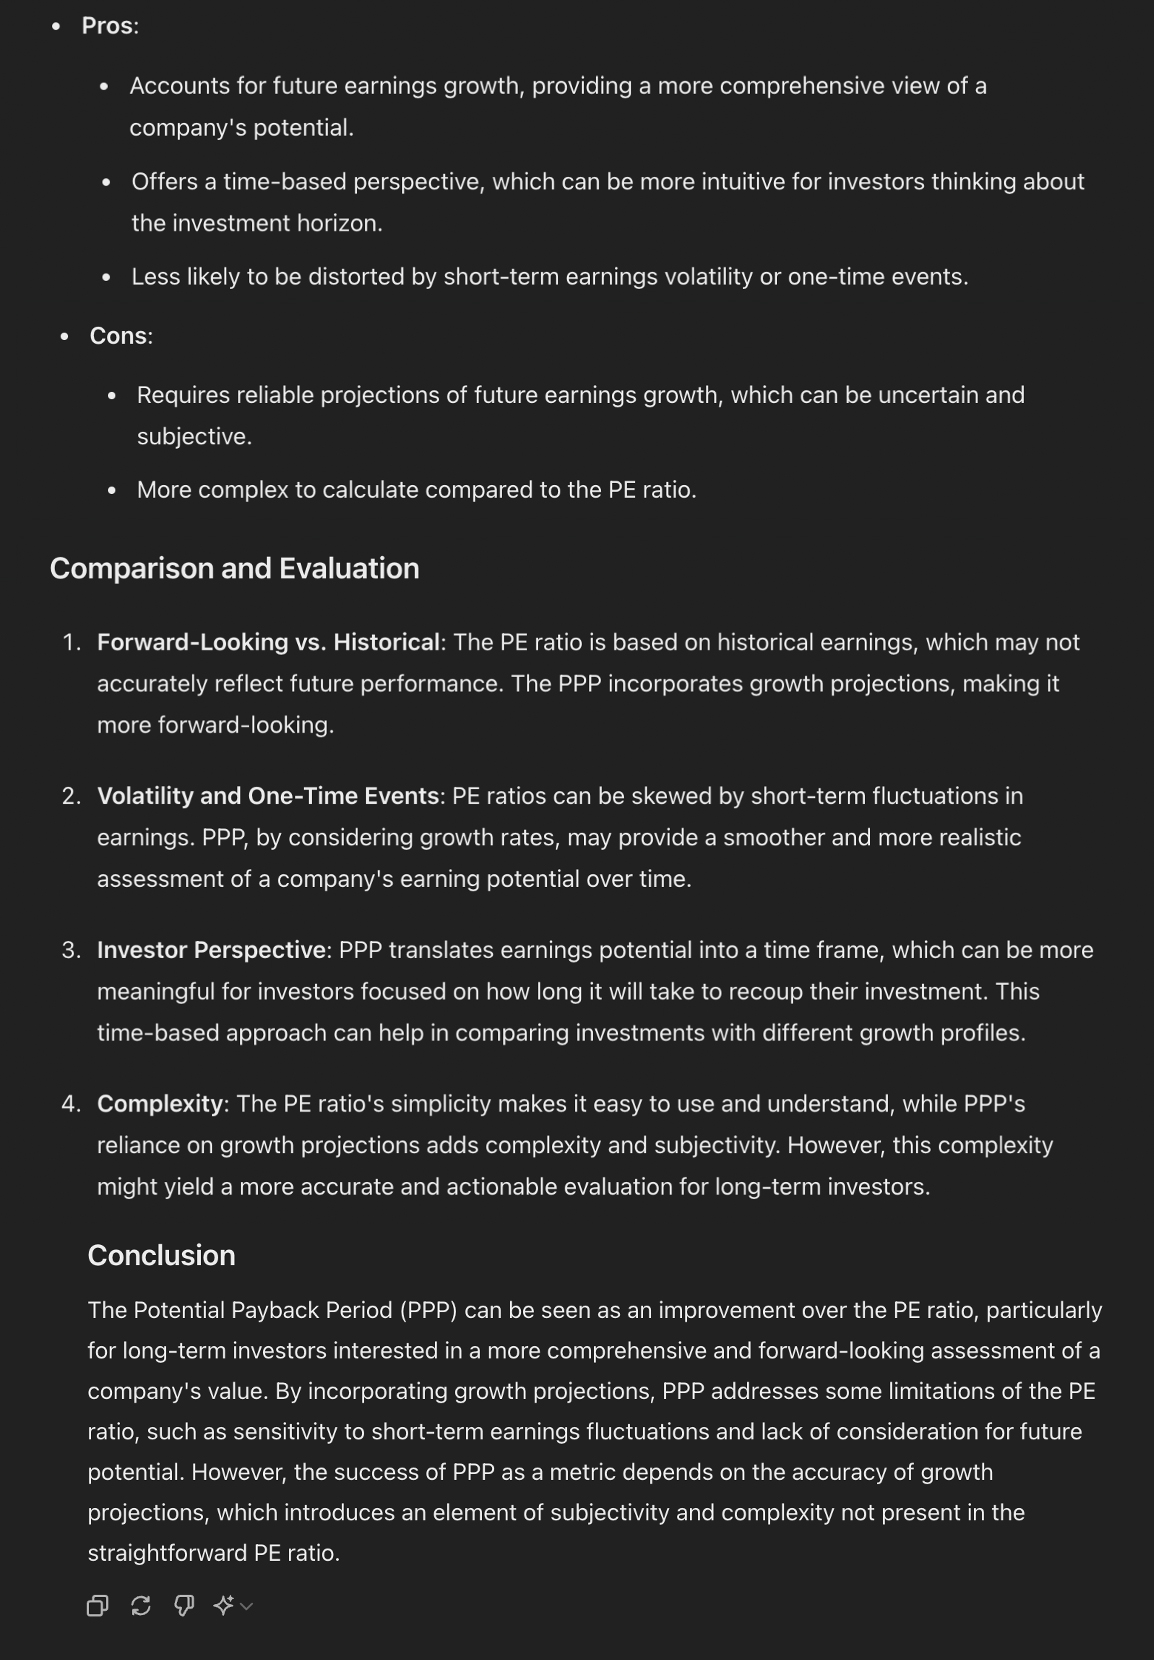
ChatGPT explains how the Potential Payback
Period (PPP) represents an
improvement over the Price-Earnings (PE) Ratio.