EXPECTED EVOLUTION OF FINANCIAL MARKETS IN 2024
Market correction in the US / Continued bull market in Japan
To understand what can be expected from financial markets in 2024, we
must first try to see where they precisely stand at the end of 2023.
The following observations can be made from the table below.
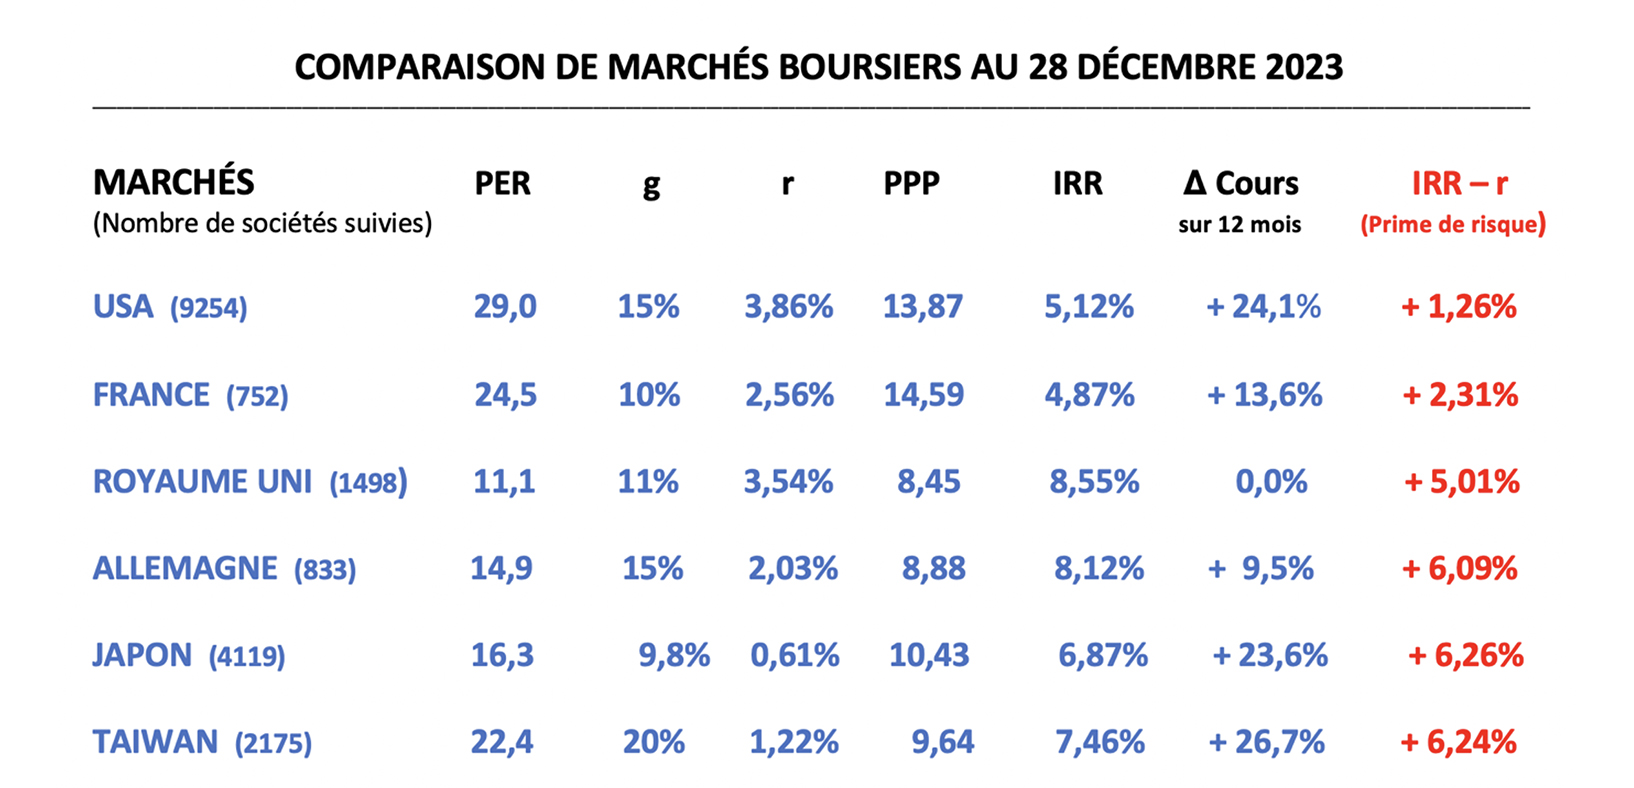
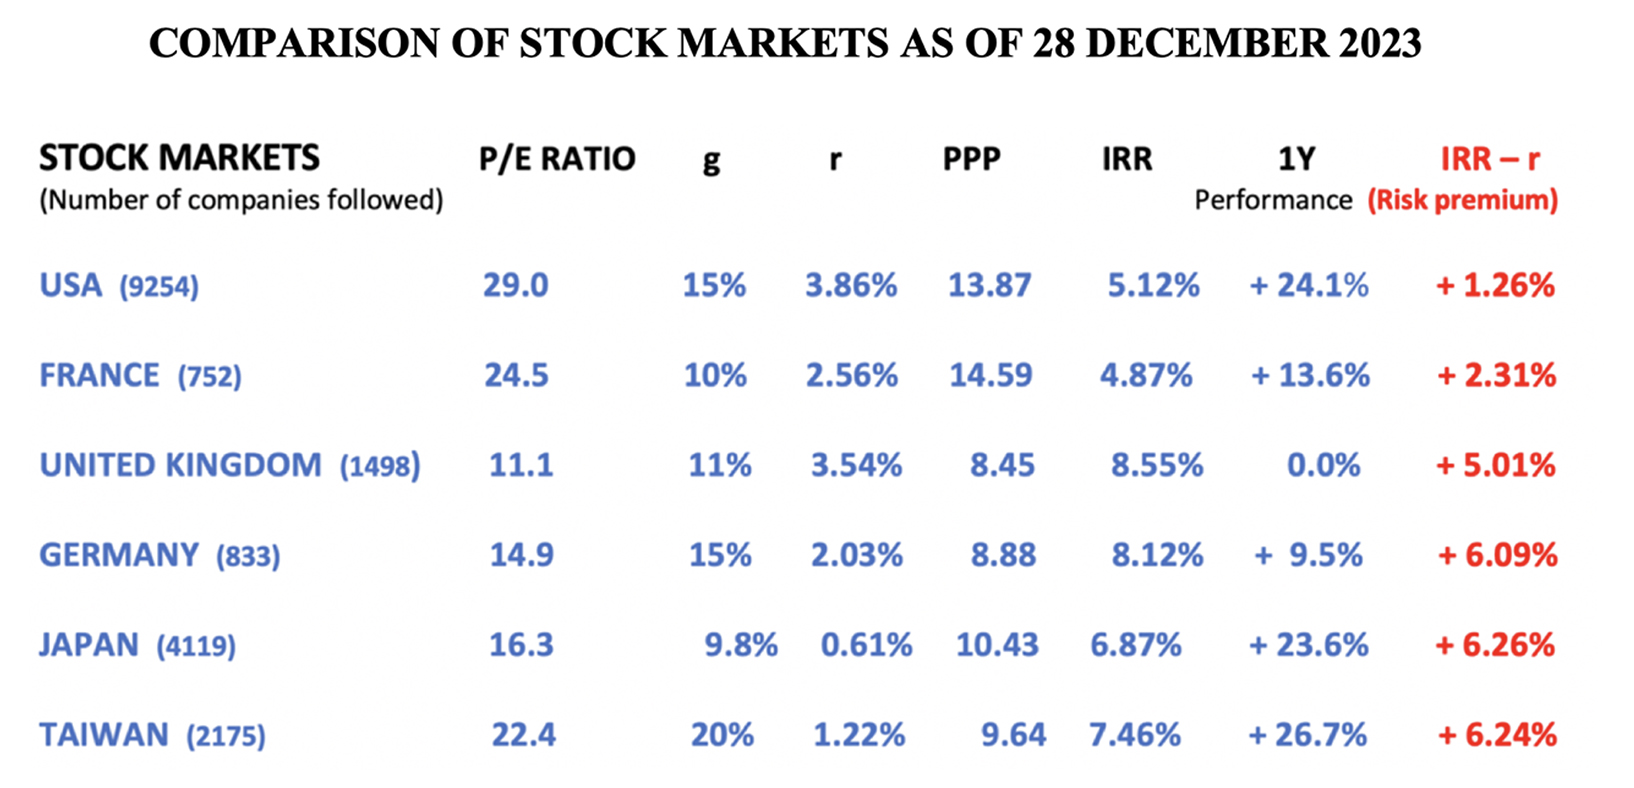
As of December 28, 2023, the P/E Ratios (PER) for different markets are
very disparate, varying almost from simple to triple: 11.1 for the
United Kingdom and 29.0 for the USA.
Performance over the past year is also highly contrasting, ranging from
0% for the United Kingdom to 24% for the United States and Japan, and
even 26% for Taiwan.
However, if we adjust the P/E Ratio to account for differentials in the
level of earnings growth rates and the level of interest rates –
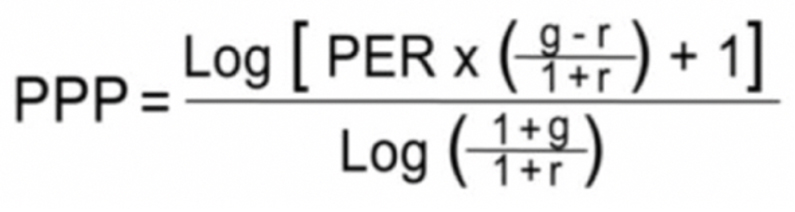
according to the concept of the Potential Payback Period (PPP) – stock
markets then appear to be evaluated in a more homogenous manner, with
PPP varying in a much narrower range, less than from simple to double:
8.45 for the United Kingdom and 14.59 for France.
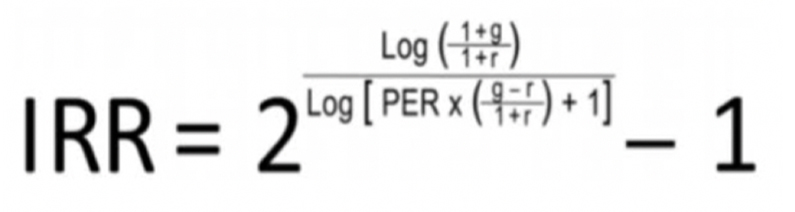
From the PPP of each market, we can directly calculate the Internal Rate
of Return (IRR) of that market. The IRR is the discount rate that must
be applied to future profits made over the period corresponding to the
PPP for these profits to equalize the current stock price.
Unlike the unadjusted P/E Ratio which can show disparate figures to the
point of becoming absurd, the IRR is always represented by meaningful
and realistic figures for all stocks on all markets. In our example the
figures stand between 4.87% and 8.55%. This shows markets’ rationality
when we use the right metrics.
The stock's IRR is to be compared with the yield of a long-term
risk-free bond, with the difference between the two rates being the risk
premium specific to each stock or stock market as a whole. The risk
premium may not be fully justified. At a given moment, it may be
considered too high or too low, leading to corrective movements.
The concept of PPP and IRR is explained in detail at
https://www.stockinternalrateofreturn.com/Genesis.html
As of 28 December 2023, the risk premium for the U.S. market is 1.26%.
This level is historically low. It seems excessively low compared to
that of other major markets like the Japanese market (6.24%).
With such a high risk premium, the Japanese market becomes relatively
very attractive.
Based on the fundamental elements we have just examined (PER, earnings
growth rate, and interest rate), we can suggest that the U.S. market has
very limited upside potential in 2024 and may even correct to raise the
risk premium.
On the other hand, with a relatively high risk premium of 6.24%, the
Japanese market should continue its rise in this new year.
With risk premiums of 6.09% and 6.24% respectively, the German and
Taiwanese markets also present promising appreciation prospects.
The reliability of these forecasts based on the concepts of PPP and IRR depends on the reliability and accuracy of the forecasted data entered into the model, particularly the projected earnings growth rate for the next 12 to 36 months. Any revision of earnings outlook in a stock market will lead to a re-evaluation of that market compared to other stock markets through a modification in the hierarchical ranking of the risk premium.
P/E Ratio = PER = Price Earnings
Ratio.
g = Projected earnings growth
rate for the next two or three years.
r = Long-term interest rate on a
risk-free bond (such as the 10-Year U.S. Treasury Note).
PPP = Potential Payback Period.
This is the time needed for the investment in the purchase of a stock to
be "potentially paid back" through future profits progressing at rate
"g" and discounted at rate "r".
IRR = Internal Rate of Return. This is the discount rate that must be applied to future profits made over the period corresponding to the PPP for these profits to equalize the current stock price. The IRR formula is directly derived from the PPP.
See mathematical demonstrations at
https://www.stockinternalrateofreturn.com/Mathematics.html
Source of data: The figures for P/E Ratio (excepted for France’s) and
projected earnings growth rates "g" come from Simply Wall St at
https://simplywall.st?via=rainsy
Rainsy Sam