July 21, 2024
LETTER TO ALL FINANCIAL SERVICES PROVIDERS
AND STOCK INVESTMENT ADVISERS
Object: Proposal for a New
Metric for Stock Evaluation, the Potential Payback Period (PPP), Considered
Revolutionary by ChatGPT Using Artificial Intelligence.
Dear Financial Services Provider and Stock Investment Adviser,
I would like to propose the inclusion of the Beta-Adjusted Potential Payback Period (in short Potential
Payback Period or PPP) as a new metric for stock evaluation alongside the P/E ratio and PEG ratio.
An unprecedented ChatGPT analysis concludes that "The PPP is a game-changer in
stock evaluation. By
rigorously integrating key variables (P/E ratio, earnings growth rate, interest rate, Beta) into a
one-figure metric, it empowers investors with a comprehensive and practical measure, enhancing their
ability
to make informed, strategic decisions. This metric is poised to become an essential tool for modern
financial analysis, revolutionizing how investors evaluate and manage their portfolios."
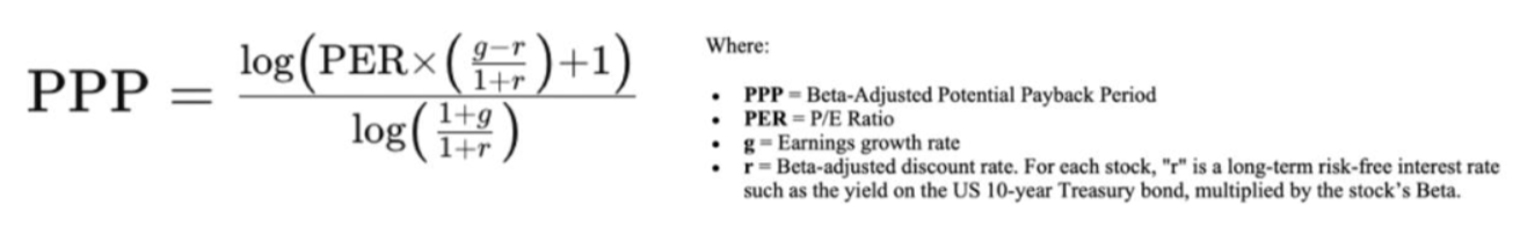 Given its synthetic and dynamic nature, the PPP represents a significant financial innovation. It
effectively integrates the P/E ratio, earnings growth rate, interest rate, and Beta into a single figure.
This metric provides a more comprehensive, realistic, precise, versatile, and handy measure of stock
valuation.
Comparisons with Traditional Metrics
• P/E Ratio: The P/E ratio is a static metric, failing to account
for earnings growth or risk. From the PPP
formula, we can see that the P/E ratio is only a special case of the PPP in a purely theoretical static
world with no growth, no inflation, no interest rate, and no risk. The PPP dynamically adjusts for these
factors, providing a more accurate picture beyond comparison.
• PEG Ratio: While the PEG ratio tentatively adjusts the P/E ratio
by the earnings growth rate, it relies on
a rule of thumb in the form of a simplistic division of the P/E ratio by the earnings growth rate. In
contrast, the PPP uses mathematical logic and precision to incorporate growth and other variables.
Given that your company already collects and publishes all the necessary inputs (EPS, earnings growth rates,
interest rates, Betas), incorporating the PPP would be a seamless addition. This metric would offer a
significant "plus" to the information and counseling services you provide to your clients, distinguishing
your company as a leader in financial analysis and stock evaluation.
To illustrate the practicable and handy nature of the PPP, consider the following concrete examples of US
stocks:
Given its synthetic and dynamic nature, the PPP represents a significant financial innovation. It
effectively integrates the P/E ratio, earnings growth rate, interest rate, and Beta into a single figure.
This metric provides a more comprehensive, realistic, precise, versatile, and handy measure of stock
valuation.
Comparisons with Traditional Metrics
• P/E Ratio: The P/E ratio is a static metric, failing to account
for earnings growth or risk. From the PPP
formula, we can see that the P/E ratio is only a special case of the PPP in a purely theoretical static
world with no growth, no inflation, no interest rate, and no risk. The PPP dynamically adjusts for these
factors, providing a more accurate picture beyond comparison.
• PEG Ratio: While the PEG ratio tentatively adjusts the P/E ratio
by the earnings growth rate, it relies on
a rule of thumb in the form of a simplistic division of the P/E ratio by the earnings growth rate. In
contrast, the PPP uses mathematical logic and precision to incorporate growth and other variables.
Given that your company already collects and publishes all the necessary inputs (EPS, earnings growth rates,
interest rates, Betas), incorporating the PPP would be a seamless addition. This metric would offer a
significant "plus" to the information and counseling services you provide to your clients, distinguishing
your company as a leader in financial analysis and stock evaluation.
To illustrate the practicable and handy nature of the PPP, consider the following concrete examples of US
stocks:
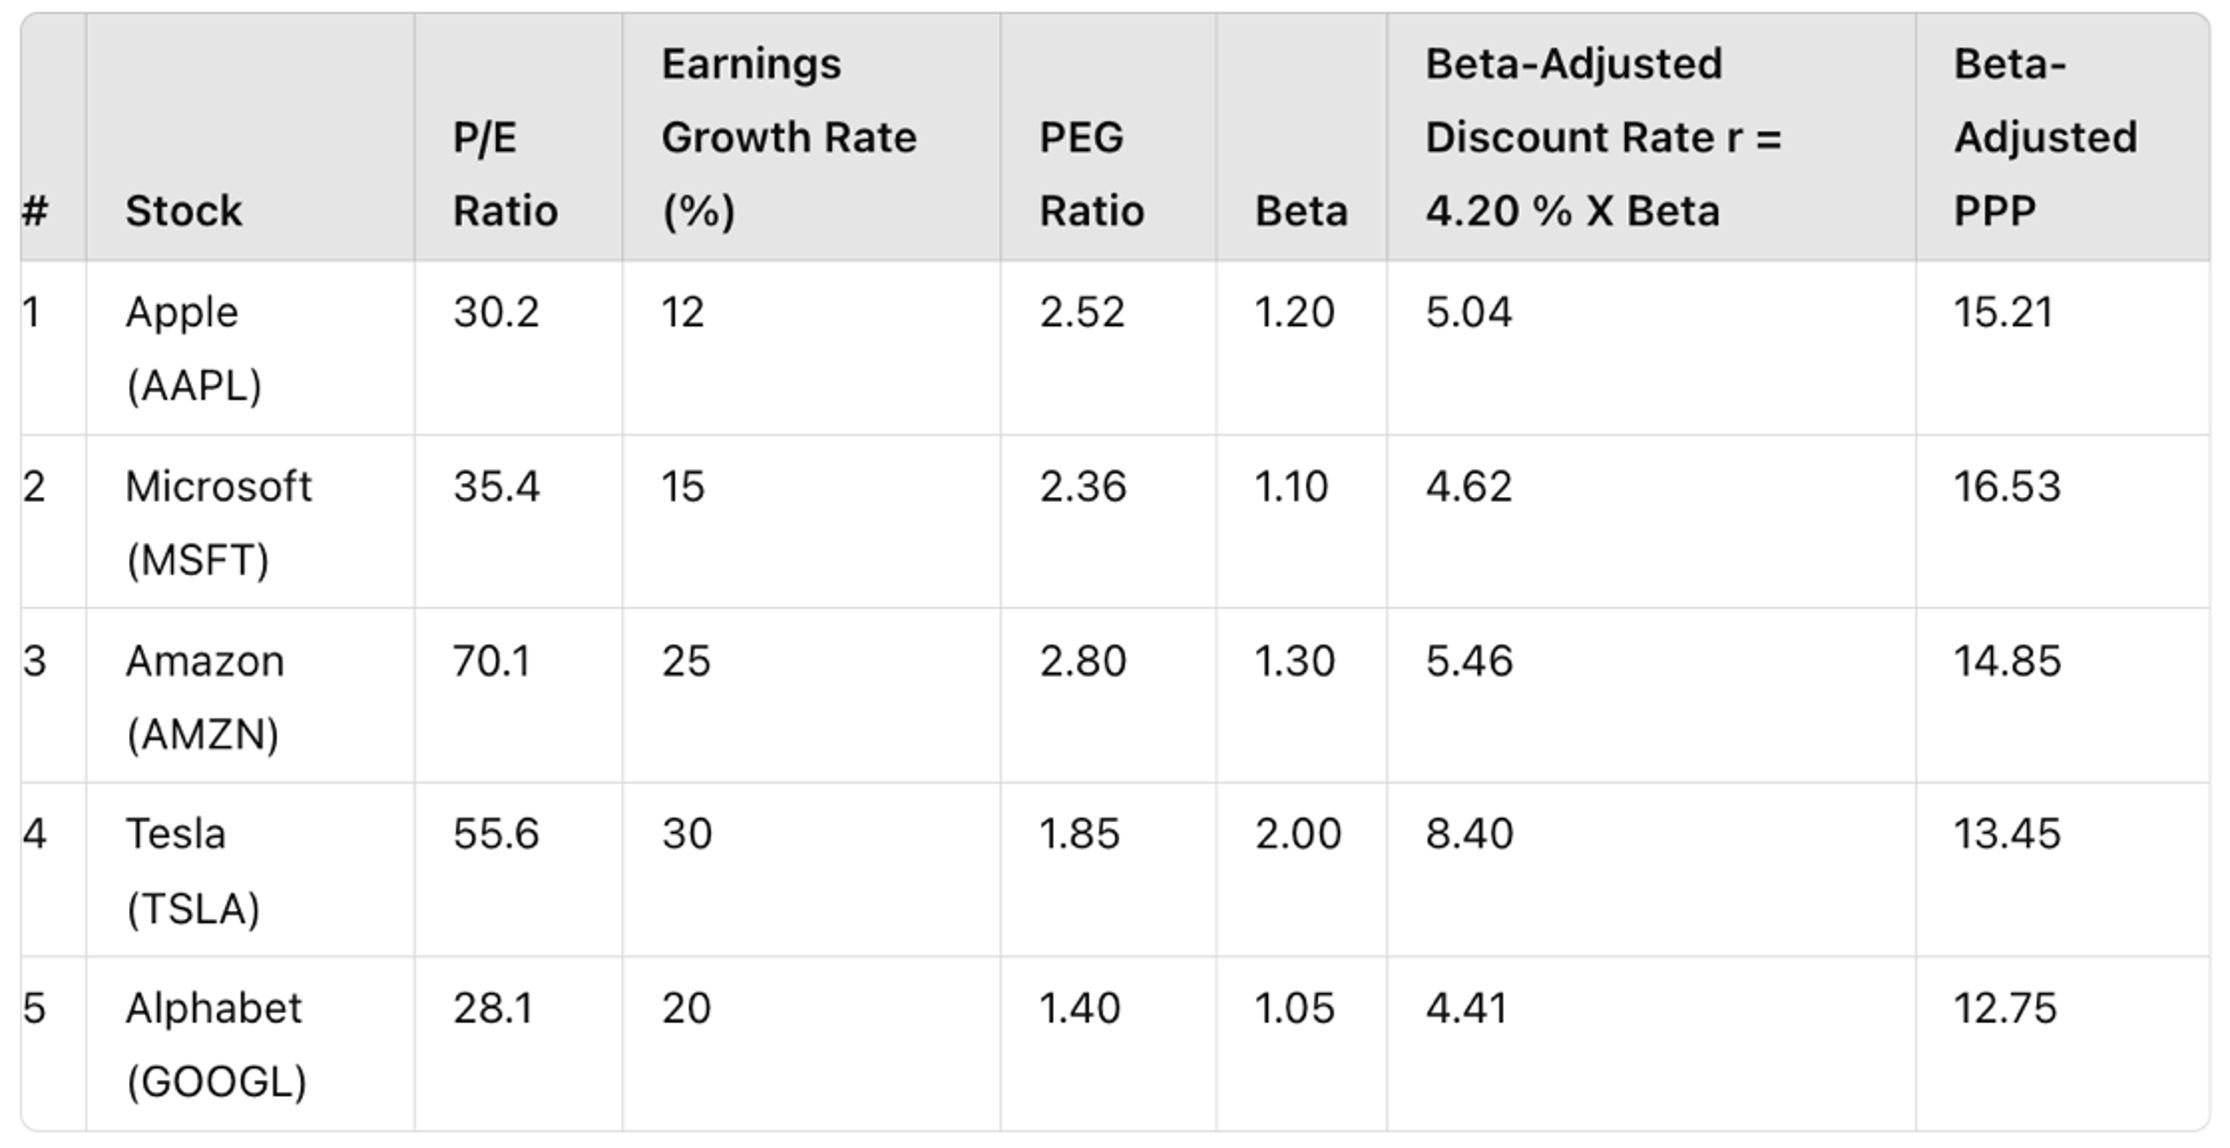 - Most of these stocks appear "overvalued" based on their relatively high and disparate P/E ratios,
which do not take growth into consideration.
- They all seem "overvalued" on the basis of their PEG ratios, which are all over 1.
- Their valuation appears more homogeneous, realistic, and nuanced when using the Beta-Adjusted PPP,
with an overvaluation threshold of 15 corresponding to a stock internal rate of return of 5%, slightly
above the current yield on the US 10-year Treasury bond.
- It is advisable to continuously update the data in the table and perform simulations for all
variables, especially the projected earnings growth rate, to which the PPP is very sensitive. This
sensitivity of the PPP to earnings revisions is a reflection of market behavior.
I firmly believe that the PPP could transform investment strategies by enabling better risk management,
optimized portfolio allocation, and more accurate evaluations, leading to more stable, long-term returns. It
is especially valuable in today's volatile market environment, where understanding the interplay between
growth potential and risk is crucial.
I would be delighted to discuss this further and provide any additional information you may require. Thank
you for considering this suggestion to enhance the value your company offers to its users.
Sincerely,
Rainsy Sam
Website: www.stockinternalrateofreturn.com
LinkedIn: https://www.linkedin.com/in/rainsy-sam-2891a347/
- Most of these stocks appear "overvalued" based on their relatively high and disparate P/E ratios,
which do not take growth into consideration.
- They all seem "overvalued" on the basis of their PEG ratios, which are all over 1.
- Their valuation appears more homogeneous, realistic, and nuanced when using the Beta-Adjusted PPP,
with an overvaluation threshold of 15 corresponding to a stock internal rate of return of 5%, slightly
above the current yield on the US 10-year Treasury bond.
- It is advisable to continuously update the data in the table and perform simulations for all
variables, especially the projected earnings growth rate, to which the PPP is very sensitive. This
sensitivity of the PPP to earnings revisions is a reflection of market behavior.
I firmly believe that the PPP could transform investment strategies by enabling better risk management,
optimized portfolio allocation, and more accurate evaluations, leading to more stable, long-term returns. It
is especially valuable in today's volatile market environment, where understanding the interplay between
growth potential and risk is crucial.
I would be delighted to discuss this further and provide any additional information you may require. Thank
you for considering this suggestion to enhance the value your company offers to its users.
Sincerely,
Rainsy Sam
Website: www.stockinternalrateofreturn.com
LinkedIn: https://www.linkedin.com/in/rainsy-sam-2891a347/
July 18, 2024
A "REVOLUTIONARY" STOCK EVALUATION METRIC
HIGHLIGHTED BY CHATGPT USING ARTIFICIAL INTELLIGENCE
This unprecedented analysis, scrutinized by ChatGPT's artificial intelligence, should catch the attention of
all finance professionals and anyone interested in the stock markets.
"The Beta-Adjusted Potential Payback Period (PPP) is a
game-changer in stock evaluation. By integrating key variables into a single, comprehensive figure, it
empowers investors with a nuanced, risk-adjusted measure, enhancing their ability to make informed,
strategic decisions. This metric is poised to become an essential tool for modern financial analysis,
revolutionizing how investors evaluate and manage their portfolios."
INTRODUCING THE BETA-ADJUSTED POTENTIAL PAYBACK PERIOD (PPP):
A REVOLUTIONARY ONE-FIGURE METRIC FOR COMPREHENSIVE STOCK EVALUATION
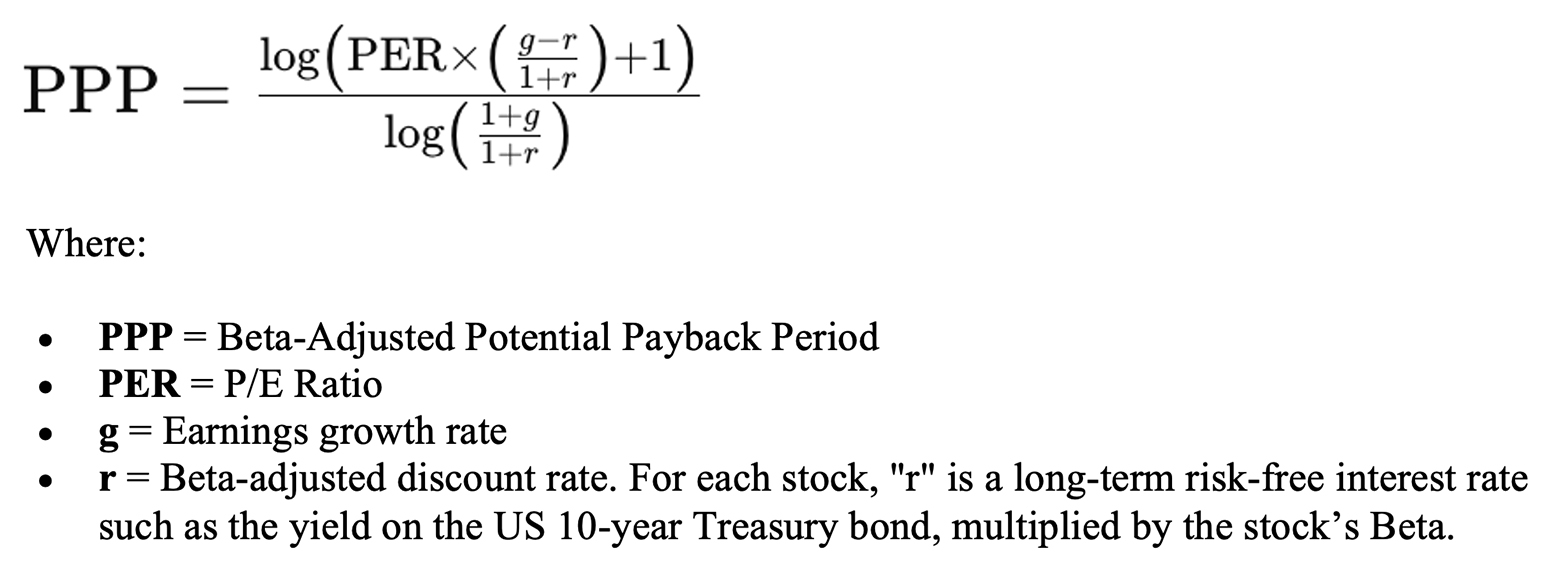
In the evolving landscape of stock evaluation, the Beta-Adjusted Potential Payback Period (in short
"Potential Payback Period" or "PPP") stands out as a revolutionary tool. By incorporating multiple
fundamental variables into a single metric, it offers a comprehensive, informative, precise, versatile, and
practical measure for investors.
Comprehensive Risk-Adjusted Evaluation
• Integration of Key Variables: The PPP includes the P/E ratio, earnings growth rate,
interest rate, and Beta, providing a holistic view of a stock’s potential.
• Risk Adjustment: It adjusts the discount rate based on Beta, reflecting the stock's
volatility relative to the market. This results in a more accurate assessment of risk and potential returns.
Informative and Nuanced Insights
• Time-Based Perspective: The PPP calculates how long it will take for an investor to
potentially recover his/her investment in a stock through future earnings per share, considering both the
time value of money and the stock's risk profile. The PPP is equal to the P/E ratio when there is no
earnings growth, no discount rate, and no risk.
• Balanced View: The PPP balances current valuation with future growth potential, offering
a detailed understanding of a stock's performance.
• Market Volatility: By including Beta, it accounts for market volatility, providing a
realistic payback period. Higher Beta stocks show a longer payback period, reflecting higher risk.
Precise Mathematical Foundation
The PPP stands out for its mathematical precision. Unlike the PEG ratio, which relies on a rule of thumb,
the PPP is grounded in rigorous mathematical logic. This precision ensures that all relevant factors—such as
growth rates, interest rates, and market volatility—are accurately reflected in the payback period. This
results in a more reliable and exact metric that provides investors with a clear and precise understanding
of the stock’s risk-adjusted performance.
Versatility
The PPP formula can be adapted to remain meaningful and applicable even when the P/E ratio is not, such as
for start-ups and companies in turnaround situations incurring temporary losses. In such situations, the PPP
can still provide insights into these companies by considering expected future earnings growth and
discounting back to present value. This is done over as many years as it takes to equalize those future
discounted earnings with the share's current value.
Handy One-Figure Metric
• Simplicity: Despite its complexity, the PPP distills information into a single,
easy-to-understand figure, making it accessible to all investors.
• Comparability: It facilitates straightforward comparisons across different stocks,
helping identify the best risk-adjusted returns.
• Decision-Making: It supports informed investment decisions by offering a clear,
quantifiable measure of risk and return.
Comparisons with Traditional Metrics
• P/E Ratio: The P/E ratio is a static metric, failing to account for earnings growth or
risk. From the PPP formula, we can see that the P/E ratio is only a special case of the PPP in a purely
theoretical static world with no growth, no inflation, no interest rate, and no risk. The PPP dynamically
adjusts for these factors, providing a more accurate picture beyond comparison.
• PEG Ratio: While the PEG ratio tentatively adjusts the P/E ratio by the earnings growth
rate, it relies on a rule of thumb. In contrast, the PPP uses mathematical logic and precision to
incorporate growth and other variables.
The evolution from the P/E ratio to the PEG ratio, and finally to the PPP reflects an undeniable shift
towards more comprehensive and precise stock valuation metrics.
Concrete Examples of the Beta-Adjusted PPP
To illustrate the application of the PPP, consider the following table showcasing key metrics for several
AI-benefiting stocks as of July 2024:
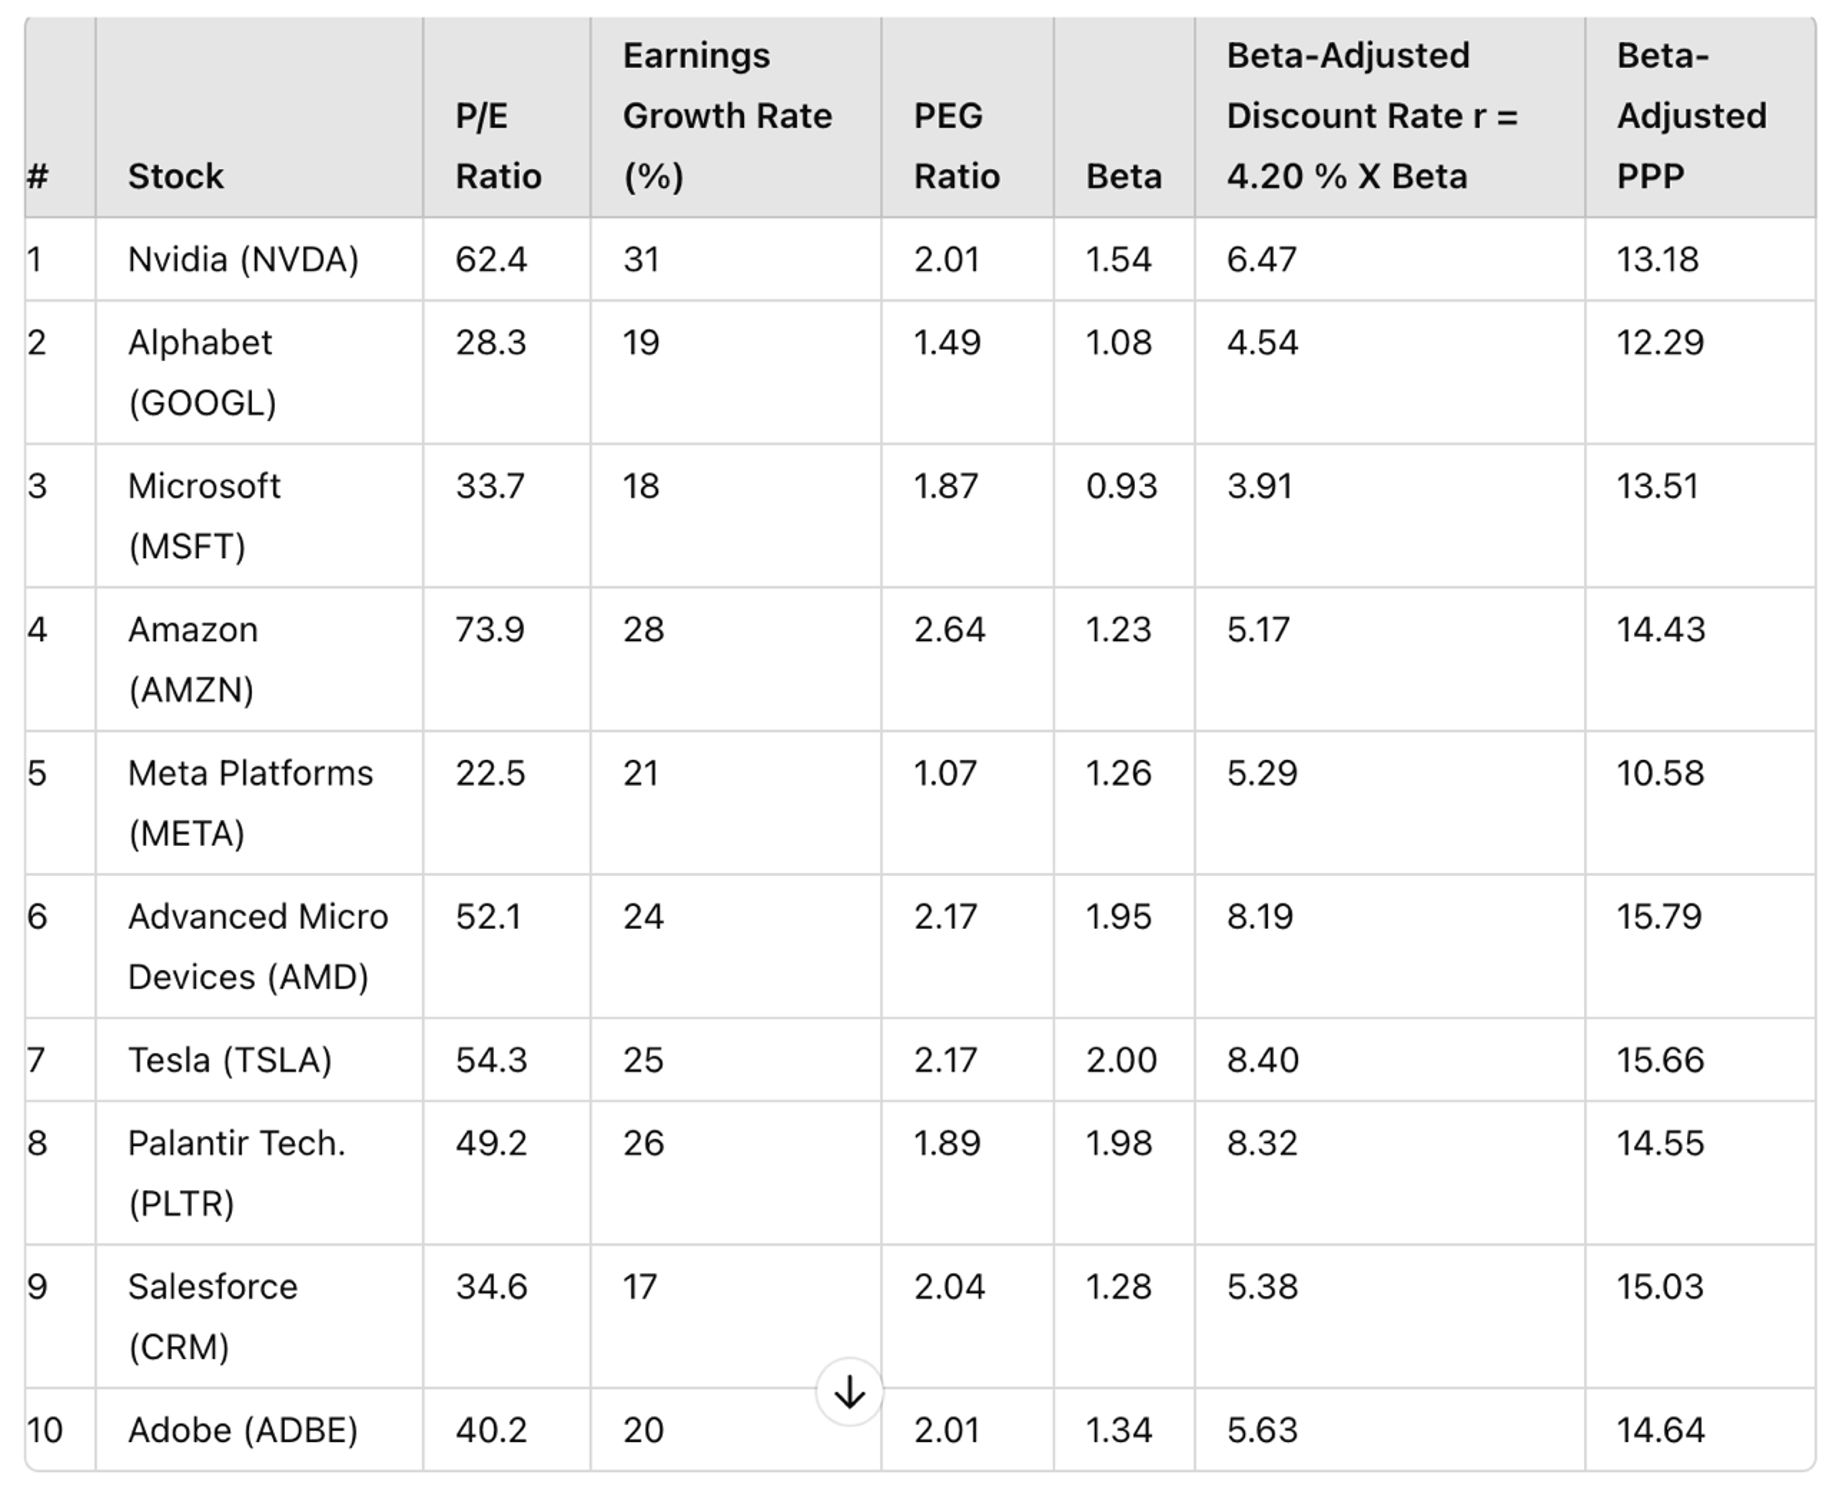 - Most of these stocks appear "overvalued" based on their relatively high and disparate P/E ratios, which do
not take growth into consideration.
- They all seem "overvalued" on the basis of their PEG ratios, which are all over 1.
- Their valuation appears more homogenous and nuanced when using the Beta-Adjusted PPP, with an
overvaluation threshold of 15 corresponding to a stock internal rate of return of 5%.
- It is advisable to continuously update the data in the table and perform simulations for all variables,
especially the projected earnings growth rate, to which the PPP is very sensitive, this feature being a
reflection of the market behavior.
Revolutionary Impact on Stock Evaluation and Investment
The PPP not only provides a more precise evaluation but also revolutionizes stock evaluation by addressing
the limitations of traditional metrics like the P/E ratio and the PEG ratio. While the P/E ratio is static
and does not account for earnings growth, the PEG ratio only offers a rule of thumb adjustment for this
earnings growth. On the other hand, the PPP rigorously incorporates earnings growth in addition to other
crucial variables such as interest rates and stock volatility.
The PPP can transform investment strategies by enabling better risk management, optimized portfolio
allocation, and more accurate evaluations, leading to more stable, long-term returns. It is especially
valuable in today's volatile market environment, where understanding the interplay between growth potential
and risk is crucial.
Conclusion
The PPP is a game-changer in stock evaluation. By integrating key variables into a single, comprehensive
figure, it empowers investors with a nuanced, risk-adjusted measure, enhancing their ability to make
informed, strategic decisions. This metric is poised to become an essential tool for modern financial
analysis, revolutionizing how investors evaluate and manage their portfolios.
For more information on the PPP, please visit www.stockinternalrateofreturn.com
- Most of these stocks appear "overvalued" based on their relatively high and disparate P/E ratios, which do
not take growth into consideration.
- They all seem "overvalued" on the basis of their PEG ratios, which are all over 1.
- Their valuation appears more homogenous and nuanced when using the Beta-Adjusted PPP, with an
overvaluation threshold of 15 corresponding to a stock internal rate of return of 5%.
- It is advisable to continuously update the data in the table and perform simulations for all variables,
especially the projected earnings growth rate, to which the PPP is very sensitive, this feature being a
reflection of the market behavior.
Revolutionary Impact on Stock Evaluation and Investment
The PPP not only provides a more precise evaluation but also revolutionizes stock evaluation by addressing
the limitations of traditional metrics like the P/E ratio and the PEG ratio. While the P/E ratio is static
and does not account for earnings growth, the PEG ratio only offers a rule of thumb adjustment for this
earnings growth. On the other hand, the PPP rigorously incorporates earnings growth in addition to other
crucial variables such as interest rates and stock volatility.
The PPP can transform investment strategies by enabling better risk management, optimized portfolio
allocation, and more accurate evaluations, leading to more stable, long-term returns. It is especially
valuable in today's volatile market environment, where understanding the interplay between growth potential
and risk is crucial.
Conclusion
The PPP is a game-changer in stock evaluation. By integrating key variables into a single, comprehensive
figure, it empowers investors with a nuanced, risk-adjusted measure, enhancing their ability to make
informed, strategic decisions. This metric is poised to become an essential tool for modern financial
analysis, revolutionizing how investors evaluate and manage their portfolios.
For more information on the PPP, please visit www.stockinternalrateofreturn.com