Genesis
STOCK VALUATION
FROM PRICE EARNINGS RATIO (P/E) TO POTENTIAL PAYBACK PERIOD
(PPP)
TO INTERNAL RATE OF RETURN (IRR)
I would like to summarize my approach regarding the Potential Payback
Period (PPP) and the Internal Rate of Return (IRR) for stock evaluation,
from the very beginning.
In the 1980s, I noticed -- like all financial analysts and stock
portfolio managers at that time -- that the Price Earnings Ratio (PER)
was ill-suited to measure the "expensiveness" of a stock because it did
not take earnings growth into account. A PER of 10 means that the
stock's price capitalizes 10 times the earnings per share for the
starting year or, in other words, it takes 10 years of future earnings
to potentially recover the current stock price.
In this static perspective, it assumes that future earnings remain
constant from year to year. However, in reality, these future earnings
will grow at varying rates, and it is this "growth" factor that
determines whether a stock is valued more or less "expensively" in terms
of the multiple of earnings capitalization or PER. Therefore, the PER
needs to be adjusted or relativized based on the earnings growth rate.
There are intuitive methods to "adjust" the PER, such as the one
advocated by Jim Slater, which involves dividing the PER by the earnings
growth rate. A stock is considered attractive only if the quotient is
less than 1. This is an empirical and approximate method, perhaps useful
in practice, but it lacks a rigorous theoretical foundation and cannot
be applied in all circumstances.
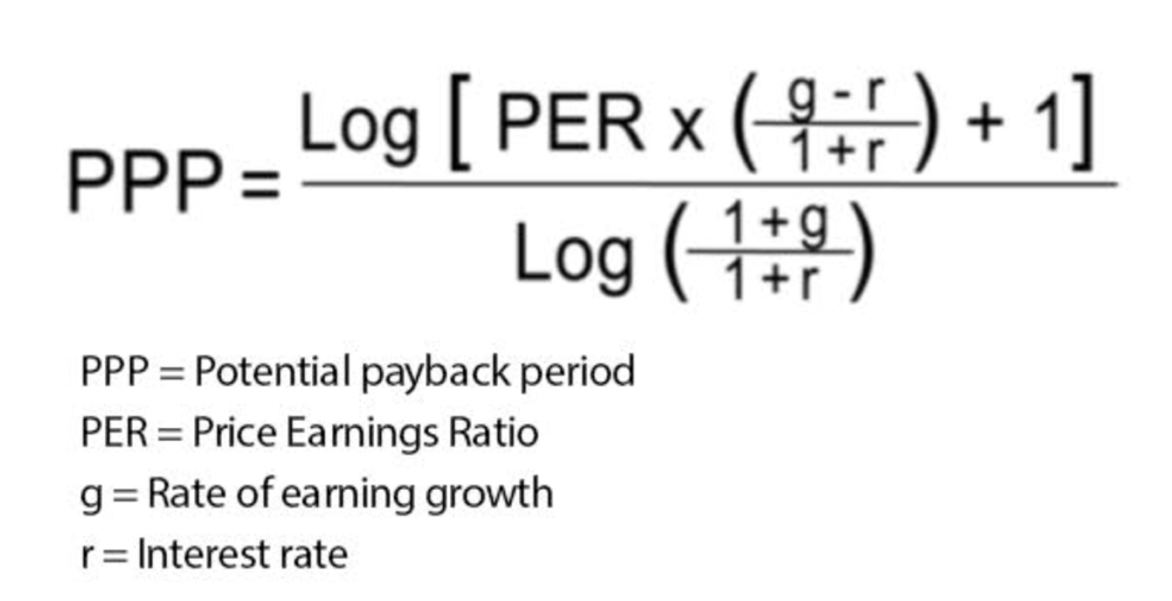
The Potential Payback Period (PPP) adjusts or relativizes the PER in a
more rigorous manner by introducing the projected earnings growth rate
to calculate a potential payback period that equalizes the current stock
price with the sum of future earnings per share. To do this, the PPP
introduces this earnings growth rate into a mathematically logical
formula. Thus, a PER of 10, meaning that it takes a "period" of 10 years
to potentially recover the stock's price based on constant earnings, is
immediately reduced (in terms of years) if we lift the assumption of
constant earnings. Assuming, for example, a profit growth rate of 8% per
year, the compounding effect brings the new adjusted PER, now called
PPP, to 7.64 years. With a growth rate of 15%, the PPP would be only
6.56 years. Thus, the PPP better measures the value of stocks by
rigorously and precisely adjusting the PER based on the expected
earnings growth, enabling more meaningful and more detailed comparisons.
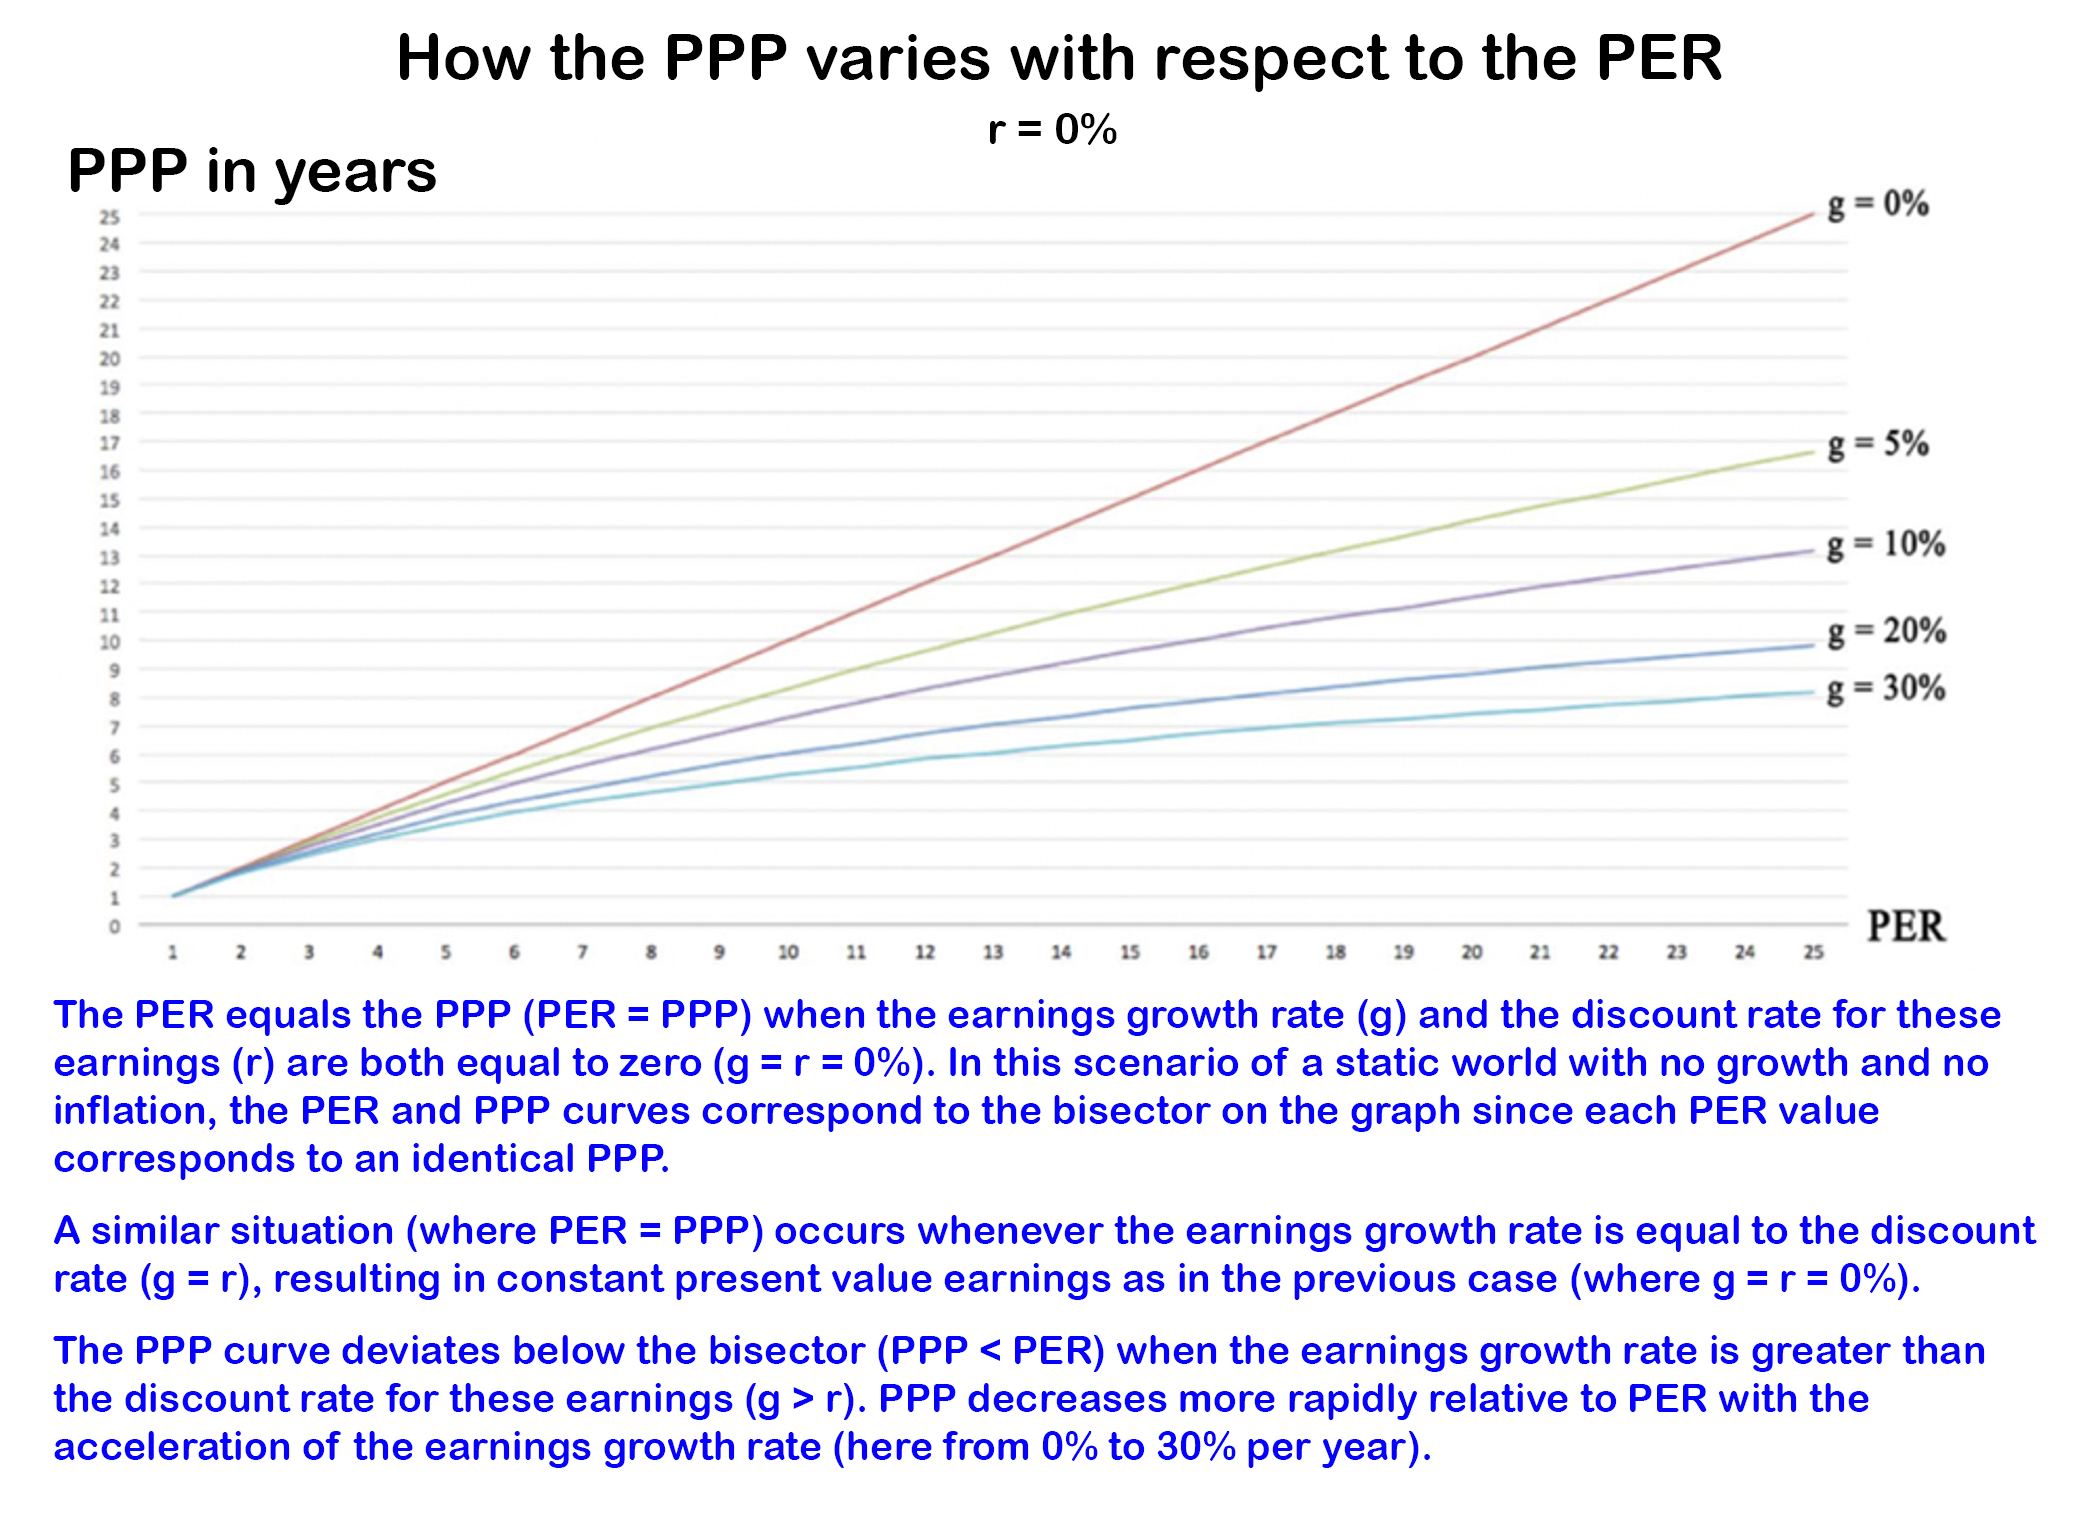
The graph below shows the relationship between PPP and PER under
different earnings growth rate assumptions.
Another essential contribution of the PPP to stock evaluation is the
consideration of interest rates that characterize the financial markets
at any given time. Indeed, to be more comprehensive, the PPP equates --
over a specific duration -- the stock's price with the present value of
future earnings. The discount rate used is none other than the long-term
bond yield, which represents an alternative investment to stocks. The
choice of this discount rate reflects the notion of opportunity cost
because if we buy stocks, we forego the yield offered by bonds.
In practice, we indeed observe that, all else being equal, when interest
rates rise, stock prices fall, and vice versa. The formula of the PPP
explains and quantifies these opposite movements, as the PPP lengthens
-- making stocks less attractive -- when the interest rate increases,
and vice versa.
Thirty years ago, I published PPP tables that have become obsolete with
the widespread use of computers and automatic calculation programs.
This PPP concept was explained in several issues of the French-based
magazine “Analyse Financière” in the 1980s, as well as in the reference
book "Finance d'Entreprise" (Corporate finance) by Pierre Vernimmen, a
professor at France’s most prestigious business school named HEC.
FROM POTENTIAL PAYBACK PERIOD (PPP) TO INTERNAL RATE OF RETURN (IRR)
More recently I started to develop the PPP concept further to make it a
more concrete and practical evaluation tool for stocks while keeping it
closely related to corporate finance for the sake of rigor. This
approach naturally led to the "Internal Rate of Return" (IRR) applied to
stocks.
From a stock’s PPP we can deduce its IRR, knowing that both the PPP and
IRR are common instruments for selecting investments in corporate
finance. In corporate finance, the IRR is the discount rate that equates
the amount of an investment with the expected net cash flows from that
investment over its life. By applying this corporate finance concept to
an investment in a stock and taking the PPP as the investment's
duration, we can extract a precise Internal Rate of Return corresponding
to each PPP value. In other words, the redefined IRR as an instrument
for evaluating a stock is the discount rate that allows an investor in a
given stock to potentially double their investment through the
cumulative earnings per share over the calculated PPP period for that
stock.
Expressed as a percentage, the IRR is more concrete and meaningful in
conveying the attractiveness and opportunity of an investment, whether
for an industrial investment or an investment in a stock market.
In the calculation method one can directly move from a "PER - Earnings
growth rate" pair to the IRR without going through the PPP.
COMPARISONS AND SIMULATIONS
Let's take the example of three stocks A, B, and C with the following
characteristics:
- Stock A: PER of 8 and earnings growth rate of 3% per year.
- Stock B: PER of 13 and earnings growth rate of 18% per year.
- Stock C: PER of 25 and earnings growth rate of 38% per year.
First, we can ask which of these three stocks is the most attractive,
given that they have significantly different PERs? In the assumption of
an interest rate = 0%, these three stocks have the same PPP (7.3 years)
and the same IRR (10.0%).
But in the scenario where the long-term bond yield rises to 4%, the IRR
for A, B, and C drops to 8.73%, 9.04%, and 9.25%, all else being equal.
This simulation shows that high-growth stocks with high PERs are less
affected by an increase in interest rates.
We can also make an international comparison where an interest rate
differential (r) adds to an earnings growth rate differential (g) to
compensate for a wide PER differential (ranging from half to double) and
practically ensure the same profitability or return (IRR) for two
apparently very different stocks A and B:
Stock A: r = 4%, g = +6%, PER = 10 -----> IRR = 7.67%
Stock B: r = 0%, g = +18%, PER = 20 -----> IRR = 7.81%
Even with a PER twice as high (20 compared to 10), B is actually more
attractive than A because its IRR (7.81%) is higher than that of A
(7.67%).
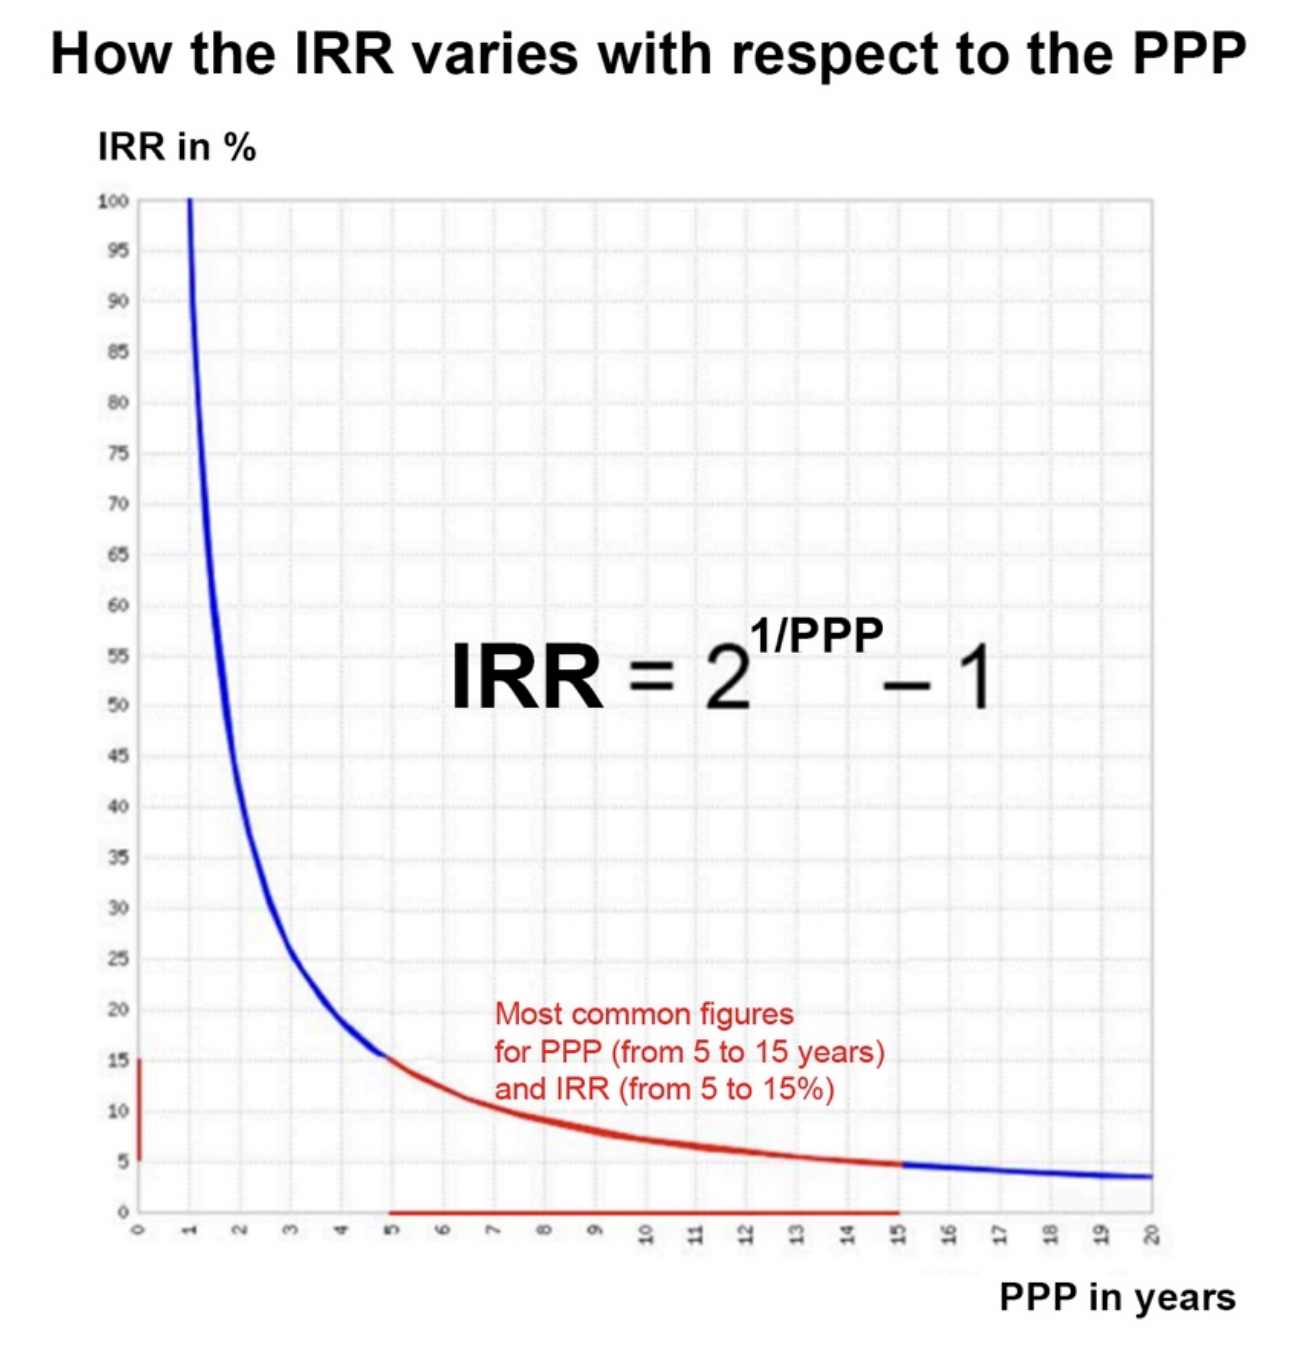
RATIONALITY AND HOMOGENEITY OF FINANCIAL MARKETS
The PP and IRR allow for testing the rationality and homogeneity of
financial markets. If one relies solely on the PER to assess the
"expensiveness" of stocks, one can arrive at absurd order-of-magnitude
values. Indeed, the PER can reach astronomical amounts when the earnings
per share for the chosen year is close to zero, and it also loses all
meaning in case of losses for the year under consideration. On the other
hand, the PPP varies -- in all cases -- over a narrower range of 5 to 15
years, corresponding to an IRR that varies -- in the opposite direction
of the PPP -- from 15 to 5%. These PPP and IRR figures can be considered
significant, realistic, and credible due to their reasonable order of
magnitude and relative stability, reflecting the rationality and
homogeneity of financial markets, as shown in the graph below depicting
the evolution of the IRR as a function of the PPP.
The return of a stock should not be confused with its yield. While the
yield of a stock is measured solely in relation to the dividend paid,
the Internal Rate of Return reflects operating performance and measures
the earnings-generating capacity of the company represented by the stock
in question, which suggests a capital gain for the stock investor
alongside earnings growth.
I hope that these reflections regarding the PPP and IRR will stimulate
reactions from professionals in the stock market who are now familiar
with rigorous analytical approaches. I hope that those interested will
continue to develop this sort of approach and help to enrich my research
aimed at evaluating stocks in a more rational manner based on
fundamental factors.