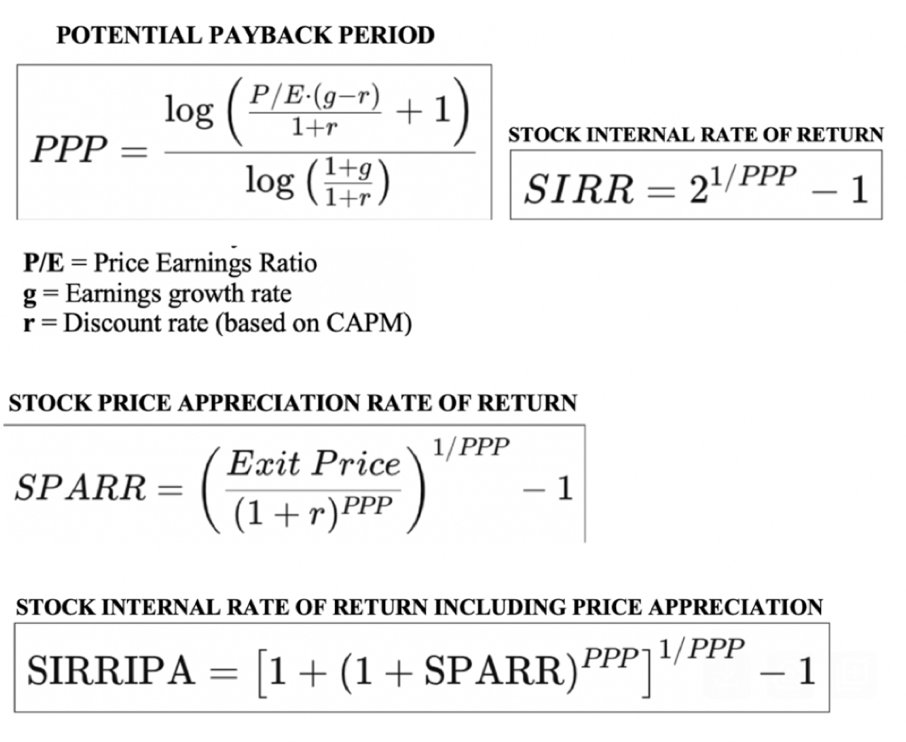
INSTANT CALCULATIONS
OF A STOCK’S POTENTIAL PAYBACK PERIOD (PPP)
AND INTERNAL RATE OF RETURN (IRR)
REGULAR FORMULAS FOR STOCKS WITH MEANINGFUL P/E RATIOS (when EPS > 0)
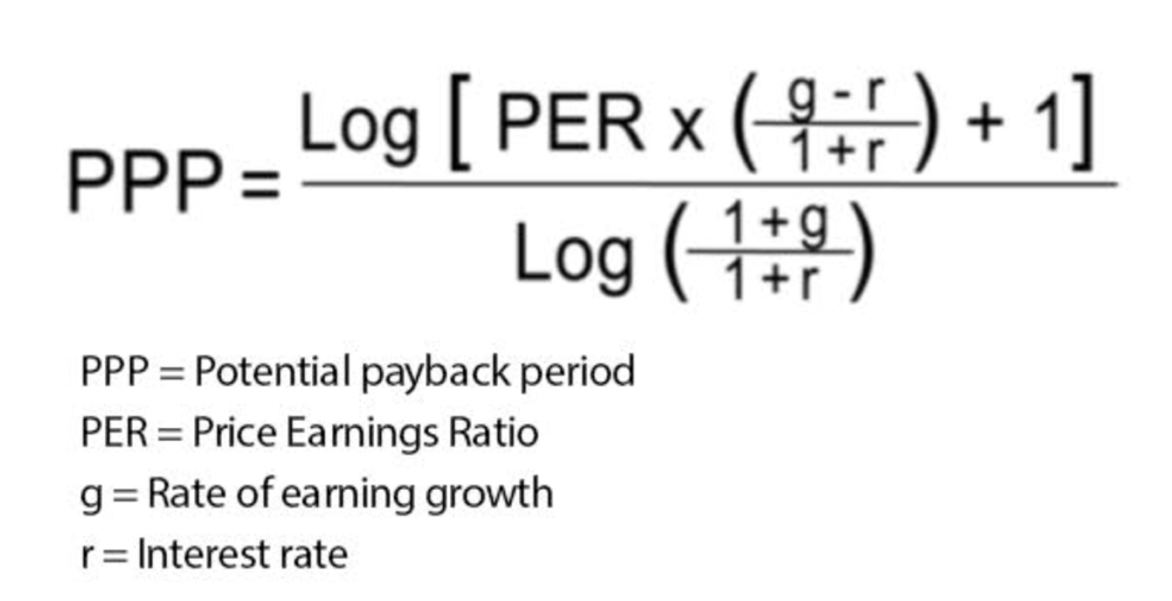
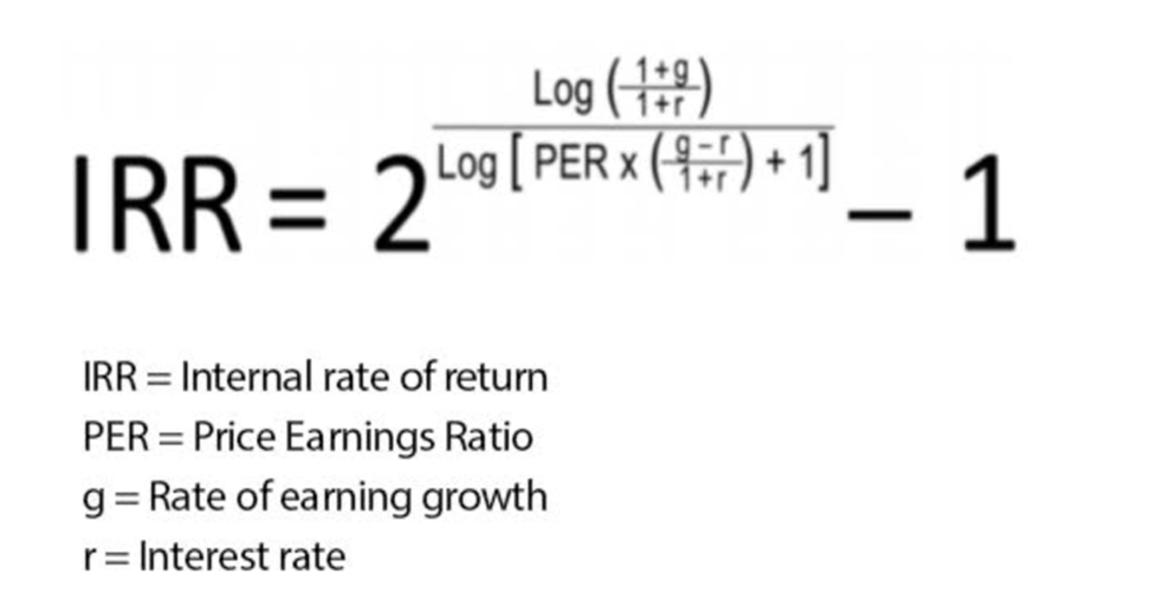
INSTANT CALCULATIONS FOR STOCKS WITH MEANINGFUL P/E RATIOS (when EPS > 0)
| # |
Companies |
Price Earnings Ratio (multiple) |
EPS Growth Rate (in %) |
Discount Rate (in %) |
Potential Payback Period (PPP) (in years) |
Internal Rate of Return (IRR) (in %) |
|---|---|---|---|---|---|---|
| Example | 27 | 18 % | 4 % | 12.14 | 5.87 % | |
| NVIDIA (*) | 61.26 | 35 % | 7.40 % | 12.32 | 5.79 % | |
| 1 | - | -% | ||||
| 2 | - | -% | ||||
| 3 | - | -% | ||||
| 4 | - | -% | ||||
| 5 | - | -% | ||||
| 6 | - | -% | ||||
| 7 | - | -% | ||||
| 8 | - | -% |
(*) Data as of August 09, 2024. Interest Rate "r" is the discount rate that includes Beta (β) as a risk factor, in line with the CAPM : r = discount rate = required rate of return = rF + β (rM - rF) with : - Risk-free interest rate (rF) = Yield on the 10-year US Treasury bond = 3.94%. - Expected market return on US stocks (rM) = 6.00%. - Beta (β) = risk factor (stock's volatility relative to the market). NVIDIA's β = 1.68.
SPECIAL FORMULAS FOR STOCKS WITH NO MEANINGFUL P/E RATIOS (when EPS < 0 or EPS ≃ 0)
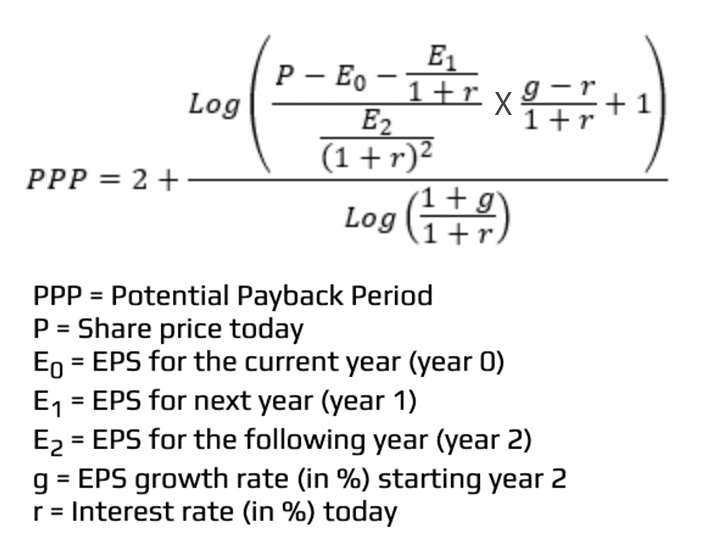
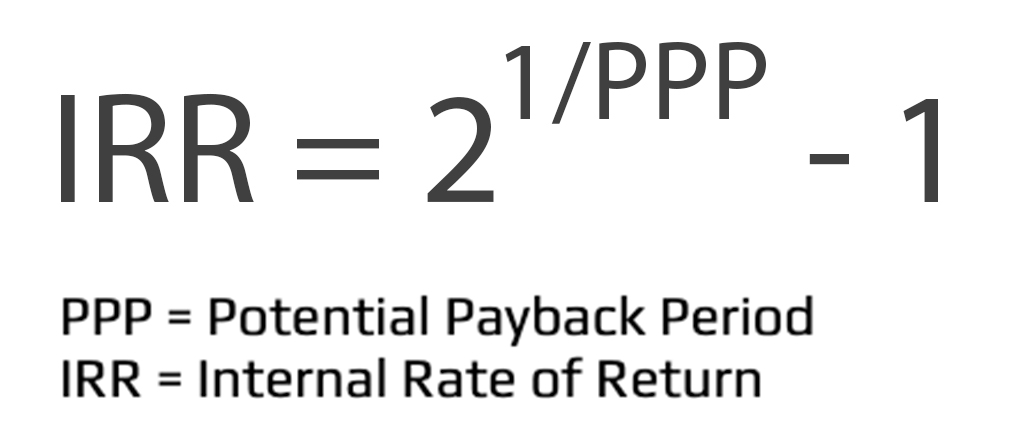
INSTANT CALCULATIONS FOR STOCKS WITH NO MEANINGFUL P/E RATIOS (when EPS < 0 or EPS ≃ 0)
| Companies | Price | EPS 2024 | EPS 2025 | EPS 2026 | g | r | PPP | IRR |
|---|---|---|---|---|---|---|---|---|
| Example | 100 | -10 | 0 | 10 | 8 % | 2.00 % | 11.01 | 6.50 % |
| MICRON TECH. (*) | 87.51 | -0.43 | 6.59 | 8.10 | 15 % | 4.14 % | 9.67 | 7.43 % |
| Company #1 | % | % | - | -% | ||||
| Company #2 | % | % | - | -% | ||||
| Company #3 | % | % | - | -% |
(*) Data as of January 21, 2024
Price = Share price today
EPS 2023 = Earnings Per Share (EPS) for the current year (year 0)
EPS 2024 = Earnings Per Share (EPS) for next year (year 1)
EPS 2025 = Earnings Per Share (EPS) for the following year (year 2)
g = EPS growth rate (in %) starting year 2
r = Interest rate (in %) today
PPP = Potential Payback Period
IRR = Internal Rate of Return
